


The Graph Price Prediction: 2025, 2030, 2040


The Graph’s price at the same time last week was $0.093. It has moved by 28.32 % in the past week and is currently at $0.11. Infact, in the past 24 hours, GRT has dumped by -1.08 %. There is a slight bearish sentiment in the crypto market. The long term sentiment, however, remains bullish and GRT could hit $0.19 in 2026.
The total circulating supply of The Graph as of writing this article was $9548531509.17 and the marketcap of GRT remains at $1,115,403,304. The Graph price in the longer term is expected to reach a high of $0.73 in 2036.
Disclaimer
For some coins with little to no data points and inexistent historical data the model by default will show a positive price prediction. There is no way for our AI bot to decipher whitepaper, tokenomics and team integrity. The coin's price that you are about to see below can fall drastically depending on many factors, so please invest wisely after checking the team and project's whitepaper. This current price prediction is done by a machine crunching numbers and the model is still in the early beta stages. It should strictly not be taken as an investment advice. Although the best engineers are currently tweaking and updating the algorithm, no human has verified the price predicted below, so please use your discretion and make a decision wisely.
GRT price prediction: Key highlights
1. Primary support and resistance levels
- The weekly chart indicated that GRT's lowest support level was $0.08, while the highest resistance was $0.44.
2. Market sentiment
- As of September 2024, the price movements reflect a bearish trend.
3. Predictive forecasts
- Projections derived from our AI/ML algorithms anticipate the average price of GRT to be over $0.40 in 2031 and $0.60 in 2035.
Discover essential details on GRT via a comprehensive weekly technical analysis, followed by the coming days of the month, upcoming months, and yearly forecast tables derived from our AI/ML-based predictive models:
GRT technical analysis: Price struggles under selling pressure
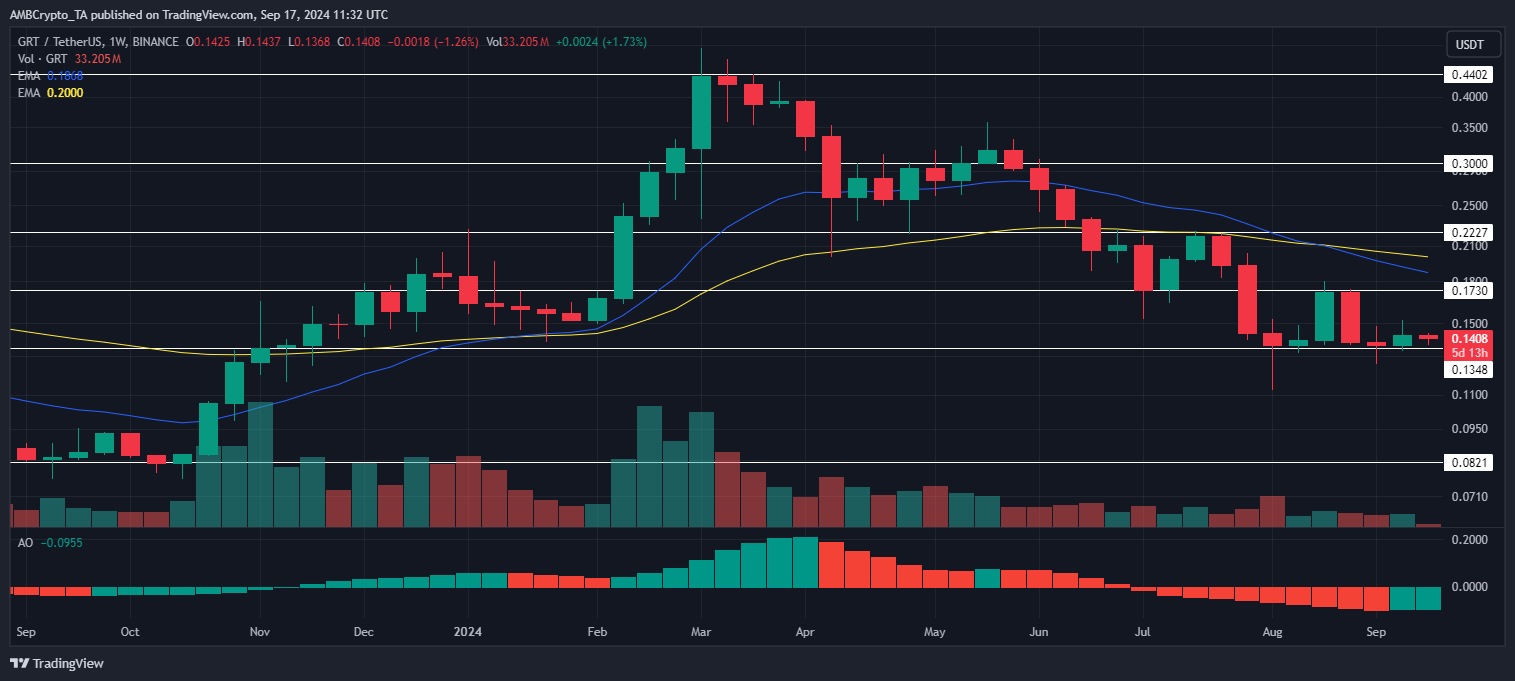
GRT’s weekly chart analysis revealed a journey filled with downturns and recoveries, framing a detailed narrative around The Graph price prediction for 2024. The period under review began with the price plunging to its lowest support of $0.08 in September.
After stabilizing, mid-October witnessed a renewed attempt to catalyze a rally. A notable period of bullish activity led the price to test the $0.22 mark in the new year. However, it was met with resistance, leading to a pullback below $0.17.
The correction was notable for its restraint, as the price did not stoop to previous lows. Furthermore, GRT witnessed a massive bull run with back-to-back bullish pumps between February and early March.
This directed it to reach a high resistance at $0.44. Once again, a correction followed, erasing the altcoin’s gains as it fell below $0.30 in April, stooping as low as $0.22. Subsequent tests of the former level succeeded in late May as the bulls briefly flipped it.
However, the market subsequently turned red. A month of continuous depreciation pulled the token to $0.17. By mid-July, buyers resurfaced to elevate the price, pushing it to challenge the support-turned-resistance at $0.22. Nonetheless, they failed. In August, the asset returned to $0.13.
Mid-month attempts to reclaim $0.17 succumbed to the broader market crash. By September, the asset was back to its previous support. As the analysis ended, GRT exchanged hands at $0.14.
Increased selling pressure could cause the token to encounter another drop on the charts. However, past defenses the bulls mounted suggest that any decline might halt at $0.13. Should this support falter, a fallback to $0.11 is conceivable.
The market condition dictated that for GRT to turn decisively bullish again, it would likely need to move over $0.22. With a successful rally over this high, the bulls can likely target the yearly peak. This level hasn’t been breached since April 2022. Therefore, substantial buying pressure would be required to flip it.
Future price predictions, rooted in predictive modeling, anticipate a rough road ahead for GRT. The projections highlight an average price of around $0.40 by 2031, expected to increase to $0.60 in 2035.
GRT's 2024 roadmap: Key indicators to watch and trade
- The trading volume peaked with price rallies. However, after the downturn in March, the volume dropped, highlighting investor caution.
- The Awesome Oscillator (AO) recovered to positive values by late November, with momentum intensifying by mid-February. However, the values declined from April, culminating in the indicator dropping below the zero line by July. At press time, it registered at -0.0955, signaling a strengthening downtrend.
- The 20 and 50 Exponential Moving Averages (EMAs) were flipped to support in late October and November, respectively. Furthermore, a golden cross formed in January. Although the Q2 2024 downturn slightly pushed the price below the 20 EMA in April, it recovered by May.
- This was followed by the candles dropping below both EMAs by early and mid-June. By mid-August, a death cross formed, indicating a continued bearish trend.


The Graph Price Prediction May 2025
The Graph (GRT) Price Check-In: May 2025
Heading into May 2025, The Graph (GRT) seems stuck in some messy, unpredictable market waters. Live prices show GRT bouncing between roughly $0.089 and $0.091. That’s a world away from its February 2021 high-water mark of $2.88, hammering home just how far the token has fallen. Wild price swings are still the name of the game; recent 30-day volatility figures clocked in anywhere from 10.37% to 17.83%, depending on who you ask. Trading over the past month hasn’t shown a clear direction – some trackers saw about half the days close up (15/30), while others counted fewer winning days (11/30). The coin hasn't looked strong lately, sometimes slipping below $0.089 and finding it tough to stay above important support zones, marking a clear slump from earlier months.
Technical charts are giving mixed signals for GRT's immediate future. You'll find sentiment readings all over the place: "Neutral" on some platforms, a confusing "Bearish Bullish 42%" on another, and one source pointing to mostly bearish technicals as of mid-April 2025. This confusion shows up in the Fear & Greed Index too, which tries to read the market's overall mood. Recent scores have jumped around – 64 (Greed), 63 (Greed), 52 (Neutral), 53 (Greed), and even 33 (Fear) – painting a picture of quickly changing attitudes among crypto traders. Important moving averages, like the 50-day SMA (recently around $0.091-$0.10) and the 200-day SMA (near $0.16-$0.20), were sitting much higher before, hinting that the longer view still looks pretty downbeat. Traders are keeping a close eye on tools like the Relative Strength Index (RSI), which spots overbought (>70) or oversold (<30) conditions, and the MACD, used to track momentum changes. RSI numbers lately have been middling, around 40.5 (Neutral) and 62.02 (Neutral, leaning towards Greed), though one report saw the MACD line cross above its signal, which could suggest some buying power returning. Solid ground seems to be near $0.09, while sellers might step in around $0.34, but these levels shift all the time.
Forecasts specifically for May 2025 don't offer much clarity either. One prediction sees a tiny dip of 0.68% by May 6th. Another thinks a bigger drop to $0.079949 could happen by May 28th. On the flip side, earlier CoinCodex numbers had suggested a May range between $0.086848 and $0.10095, averaging $0.094068. Yet, a different CoinCodex guess based on April info called for a slide to $0.07355 by May 16th. With these clashing predictions, traders are probably watching key price points like hawks. If GRT can decisively push past recent resistance, maybe near $0.107, it might signal buyers are back in control. But if it can't hold support, potentially around $0.0956 or even lower, the gloomier short-term forecasts might prove right.
Digging into the Basics: What The Graph Does and How GRT Works
Think of The Graph as a decentralized search engine, but for blockchain data – earning it the nickname "Google of Blockchains." It builds the plumbing that developers need to pull data efficiently for their decentralized apps (dApps) across many different blockchains. They do this using APIs called subgraphs and a query language called GraphQL. Several key players make the network tick: Indexers, Delegators, and Curators. Indexers run the actual computing nodes, lock up their own GRT (at least 100,000 GRT), process data requests, and get paid in query fees and indexing rewards for their work. Delegators help secure the network by lending their GRT stake to Indexers they trust, earning a cut of the rewards without running hardware. Curators use their GRT to signal which subgraphs are useful and high-quality. Finally, Consumers (mostly dApps) pay GRT to ask the network for data.
Network numbers show The Graph is operating at a serious scale and still growing. It indexes data from over 40 blockchains, including big names like Ethereum, Arbitrum, Polygon, and Avalanche, and supports tens of thousands of individual subgraphs. After moving key operations to Arbitrum to take advantage of Layer 2 benefits like cheaper fees and quicker transactions, the network saw a big jump in activity, including much higher query volumes. There are over 100 active Indexer nodes busy working, and together, the network's services have handled over 1.23 trillion queries. The amount of GRT locked up by Indexers and Delegators shows how committed participants are and helps keep the network secure.
The GRT token itself has forces pushing its supply both up and down. Ten billion GRT were created initially. New tokens come into circulation each year (initially around 3%) mainly to pay Indexers, though this rate can be changed by network governance and might eventually drop to zero. To counter this inflation, some GRT gets taken out of circulation ("burned") through a small percentage of query fees (roughly 1%), deposit taxes on Delegators and Curators, and penalties ("slashing") for Indexers who misbehave. Whether GRT becomes truly deflationary (more burned than created) depends entirely on how much the network is used and how many query fees are generated.
One big thing that historically weighed on GRT's price was its token release schedule. Large chunks of the initial supply given to early investors, the team, and others unlocked over time, especially from late 2020 through 2022. This increased the amount of GRT available to trade and likely put downward pressure on the price. While many of those early unlocks are finished, people still need to watch the remaining schedules (like the Foundation's 10-year plan) and understand the push-and-pull between new token issuance and the burn rate to figure out future supply changes. In the past, community members worried that token releases might outpace the money the network actually earns from query fees, potentially holding the price back. Getting to a point where query fees sufficiently reward Indexers and the burn rate effectively cancels out inflation is a major long-term goal for economic health.
What's Next: Development Plans and Ecosystem Growth
The main teams working on The Graph, including Edge & Node (started by the original founders), The Graph Foundation, and others in the ecosystem, are pushing forward with a big plan they call the "New Era." This strategy aims to make The Graph useful for much more than just querying subgraphs, hoping to serve a broader set of Web3 data needs. They're focused on adding verifiable data sources, supporting different ways to query data, and maybe even linking up with Large Language Models (LLMs) for smarter, AI-powered data interactions. The main goals are to make the protocol work better, make life easier for developers (DevEx), and ultimately build a massive, connected web of knowledge.
Several key steps are part of this vision. Moving the protocol's main functions and billing over to Arbitrum, an Ethereum Layer 2 network, was a huge step aimed at cutting gas fees and making the network faster. Called the "Sunrise of Decentralized Data," this move helped phase out the old centralized service and pushed dApps onto the decentralized network. Other crucial work includes technologies like Firehose and Substreams, designed to seriously speed up indexing, especially for busy blockchains, and allow for more complex data handling.
The ecosystem keeps growing by adding support for more blockchains – over 40 are now included across its services. Work is ongoing to bring in even more chains and data sources, possibly even off-chain storage like IPFS. They're also constantly trying to improve the experience for subgraph developers with better tools, testing methods, and more flexible APIs. Edge & Node is central to driving the core technology and supporting the ecosystem. Naming Rodrigo Coelho, one of the first people hired at The Graph, as CEO of Edge & Node in January 2025 shows they're still serious about decentralized progress. All these ongoing improvements are vital if The Graph wants to stay a leader in Web3 infrastructure, and they could potentially create more demand for GRT as more people use the network.
Market Mood and Community Buzz
Understanding how people feel about GRT is important because community vibe often heavily influences demand and price. Checking out conversations on places like X (what used to be Twitter), Discord, Reddit, and the official forums gives you a sense of things beyond just the network numbers. Good vibes can mean growing user confidence and might pull in new people, while negative talk could be an early warning of problems or user frustrations.
Inside The Graph's own community spaces, talk often centers on key issues like tokenomics – especially the inflation rate and unlock schedules, which have historically sparked debates about selling pressure. On the other hand, news about roadmap progress, like the "New Era" plans, the move to Arbitrum, and support for new chains, usually gets people excited and talking positively.
Looking at the general feeling around these main topics gives valuable context to price changes and network activity. Special tools designed for social media monitoring and sentiment analysis can put numbers on these general feelings. While we don't have specific real-time sentiment scores here, the long-standing community worries about supply dynamics probably play a role, along with the wider market, in how GRT's price behaves compared to its adoption progress. Clear communication that addresses these worries and highlights successes could help improve sentiment and maybe change how the market views the token's price.
How GRT Fits into the Bigger Picture: Market Ties and Economic Factors
Like almost every other altcoin, GRT's price path is closely tied to what the broader crypto market is doing and the overall economic climate. The crypto world often moves together, with Bitcoin's ups and downs frequently dictating the direction for most other coins. Even though The Graph aims to build value from its core job of indexing data, GRT's price will likely stay strongly connected to Bitcoin's performance, especially during big market shifts. Still, there might be times when GRT breaks away due to news specific to The Graph, like major tech updates or big adoption wins.
What happens in the wider crypto space also matters. As Decentralized Finance (DeFi) and Web3 grow, the need for trustworthy, decentralized data indexing naturally increases, which could be a long-term positive force for The Graph. But big negative events, like major platforms or projects failing, can shake investor confidence everywhere, hurting even solid projects.
Big-picture economics plays a huge part too. Things like inflation reports, decisions on interest rates by central banks (like the US Federal Reserve), and the general economic health affect how willing investors are to take risks. Sometimes high inflation has pushed people towards assets like Bitcoin, but rising interest rates usually make riskier investments, including crypto, less appealing. Global political events can also stir up markets, sometimes boosting the case for decentralized assets, although Bitcoin usually benefits most. So, GRT's future price will likely be a result of how these broad market and economic trends interact with its own network growth and tech developments.
GRT Price Guesses: The Long View (2025-2030)
Trying to predict The Graph's (GRT) price way out in the future shows just how much analysts disagree, underlining how volatile and speculative the crypto market really is.
For the rest of 2025, guesses are all over the map. Some see modest average prices like $0.0822 or $0.0947, maybe hitting highs between $0.138 and $0.224. More bullish forecasts throw out averages like $0.3702 or even $0.74 for the year. The possible trading range also differs, with some models seeing channels like $0.0673-$0.0778 or $0.0846-$0.1009. Bitget's prediction puts the year-end price around $0.1161.
Looking further out, the predictions scatter even more:
- 2026: Average price guesses swing from $0.176-$0.191 all the way up to $0.4333, $0.54, $0.67, and $1.11. Possible trading zones mentioned are $0.159-$0.214 and $0.4182-$0.5110. PricePrediction.net once called for $0.27, while Bitget figures $0.1102.
- 2027: Predicted averages include $0.268, $0.7588, and $1.66. Potential highs near $0.7271 pop up. PricePrediction.net had suggested $0.39 and later $0.78. Bitget's model points towards $0.1488.
- 2028: Some models think GRT might break the $1 barrier, setting average targets from $0.345 up to $2.55. PricePrediction.net aimed for $1.14. Bitget estimates $0.1875.
- 2030: This far out, the guesses are wildest. Average forecasts include $0.498, $0.587, around $2.01, $1.95, $2.52, and a very optimistic $5.47. Highs could potentially reach $2.24-$2.26, $2.32, or even $6.30. But some models are much more conservative; CoinCodex suggested a range between $0.001739 and $0.02186, while DigitalCoinPrice targets $0.36-$0.42. Bitget projects $0.2138.
These long-term guesses depend heavily on a few big 'ifs'. The optimistic views count on Web3 continuing to grow strong, demand for decentralized data indexing soaring, The Graph successfully rolling out its "New Era" features (maybe including AI stuff), and the network effect getting stronger. If The Graph becomes truly essential infrastructure and network use (generating query fees) picks up enough to possibly make the token deflationary, a major price jump isn't out of the question.
But there are still big risks. Competition in the data indexing space could heat up. There's always the chance that the ambitious development plans hit snags. Critically, the pressure from new tokens being issued and any leftover vesting unlocks needs to be balanced out by real demand for GRT based on its usefulness. And of course, the overall health of the crypto market and the wider economy will definitely have a huge impact.
In the end, while some analysts see huge long-term potential for GRT because of its core role in Web3, anyone thinking of investing needs to do their homework carefully, understand the tricky tokenomics, keep a close watch on development progress, and accept the high volatility and risks that come with crypto.
The Graph's Short Term Price Prediction
| Date | Avg Price | Lowest Price | Highest Price |
| 12 May 2025 | $0.12 | $0.11 | $0.12 |
| 13 May 2025 | $0.12 | $0.11 | $0.12 |
| 14 May 2025 | $0.12 | $0.11 | $0.12 |
| 15 May 2025 | $0.12 | $0.11 | $0.12 |
| 20 May 2025 | $0.12 | $0.11 | $0.13 |
| 25 May 2025 | $0.12 | $0.11 | $0.13 |
| 4 June 2025 | $0.12 | $0.11 | $0.13 |
| July 2025 | $0.12 | $0.11 | $0.13 |
| August 2025 | $0.12 | $0.12 | $0.13 |
| September 2025 | $0.13 | $0.12 | $0.13 |
| October 2025 | $0.13 | $0.12 | $0.14 |
| November 2025 | $0.13 | $0.12 | $0.14 |
| December 2025 | $0.13 | $0.12 | $0.14 |
The Graph price prediction 12 May 2025: The Graph's price for 12 May 2025 according to our analysis should range between $0.11 to $0.12 and the average price of GRT should be around $0.12.
The Graph price prediction 13 May 2025: The Graph's price for 13 May 2025 according to our analysis should range between $0.11 to $0.12 and the average price of GRT should be around $0.12.
The Graph price prediction 14 May 2025: The Graph's price for 14 May 2025 according to our analysis should range between $0.11 to $0.12 and the average price of GRT should be around $0.12.
The Graph price prediction 15 May 2025: The Graph's price for 15 May 2025 according to our analysis should range between $0.11 to $0.12 and the average price of GRT should be around $0.12.
The Graph price prediction 20 May 2025: The Graph's price for 20 May 2025 according to our analysis should range between $0.11 to $0.13 and the average price of GRT should be around $0.12.
The Graph price prediction 25 May 2025: The Graph's price for 25 May 2025 according to our analysis should range between $0.11 to $0.13 and the average price of GRT should be around $0.12.
The Graph price prediction 4 June 2025: The Graph's price for 4 June 2025 according to our analysis should range between $0.11 to $0.13 and the average price of GRT should be around $0.12.
The Graph price prediction July 2025: The Graph's price for July 2025 according to our analysis should range between $0.11 to $0.13 and the average price of GRT should be around $0.12.
The Graph price prediction August 2025: The Graph's price for August 2025 according to our analysis should range between $0.12 to $0.13 and the average price of GRT should be around $0.12.
The Graph price prediction September 2025: The Graph's price for September 2025 according to our analysis should range between $0.12 to $0.13 and the average price of GRT should be around $0.13.
The Graph price prediction October 2025: The Graph's price for October 2025 according to our analysis should range between $0.12 to $0.14 and the average price of GRT should be around $0.13.
The Graph price prediction November 2025: The Graph's price for November 2025 according to our analysis should range between $0.12 to $0.14 and the average price of GRT should be around $0.13.
The Graph price prediction December 2025: The Graph's price for December 2025 according to our analysis should range between $0.12 to $0.14 and the average price of GRT should be around $0.13.
The Graph's Long Term Price Prediction
The Graph’s long term Price Prediction below is a look at GRT’s future prospect with regards to price. The Graph was last seen at $0.11, with a market cap of $1,115,403,304 and trading volumes of $79,927,913. GRT’s price prediction is possible by analyzing historical price action, current developments and social sentiment from the community.
| Years | Avg Price | Lowest Price | Highest Price |
| 2025 | $0.13 | $0.1 | $0.16 |
| 2026 | $0.15 | $0.12 | $0.19 |
| 2027 | $0.18 | $0.14 | $0.21 |
| 2028 | $0.19 | $0.15 | $0.23 |
| 2029 | $0.24 | $0.19 | $0.29 |
| 2030 | $0.29 | $0.23 | $0.35 |
| 2031 | $0.33 | $0.26 | $0.39 |
| 2032 | $0.42 | $0.34 | $0.51 |
| 2033 | $0.4 | $0.32 | $0.48 |
| 2034 | $0.55 | $0.44 | $0.67 |
| 2035 | $0.47 | $0.37 | $0.56 |
| 2036 | $0.61 | $0.48 | $0.73 |
The Graph price prediction 2025: The Graph's price for 2025 according to our analysis should range between $0.1 to $0.16 and the average price of GRT should be around $0.13.
The Graph price prediction 2026: The Graph's price for 2026 according to our analysis should range between $0.12 to $0.19 and the average price of GRT should be around $0.15.
The Graph price prediction 2027: The Graph's price for 2027 according to our analysis should range between $0.14 to $0.21 and the average price of GRT should be around $0.18.
The Graph price prediction 2028: The Graph's price for 2028 according to our analysis should range between $0.15 to $0.23 and the average price of GRT should be around $0.19.
The Graph price prediction 2029: The Graph's price for 2029 according to our analysis should range between $0.19 to $0.29 and the average price of GRT should be around $0.24.
The Graph price prediction 2030: The Graph's price for 2030 according to our analysis should range between $0.23 to $0.35 and the average price of GRT should be around $0.29.
The Graph price prediction 2031: The Graph's price for 2031 according to our analysis should range between $0.26 to $0.39 and the average price of GRT should be around $0.33.
The Graph price prediction 2032: The Graph's price for 2032 according to our analysis should range between $0.34 to $0.51 and the average price of GRT should be around $0.42.
The Graph price prediction 2033: The Graph's price for 2033 according to our analysis should range between $0.32 to $0.48 and the average price of GRT should be around $0.4.
The Graph price prediction 2034: The Graph's price for 2034 according to our analysis should range between $0.44 to $0.67 and the average price of GRT should be around $0.55.
The Graph price prediction 2035: The Graph's price for 2035 according to our analysis should range between $0.37 to $0.56 and the average price of GRT should be around $0.47.
The Graph price prediction 2036: The Graph's price for 2036 according to our analysis should range between $0.48 to $0.73 and the average price of GRT should be around $0.61.
Top Coins Price Predictions


Similar Long Term Price Predictions


A Historical look at The Graph, GRT’s price
GRT/USD Pair


GRT/Euro Pair
FAQs about The Graph
The Graph’s current price is $0.11 and witnessed a -1.08% decrease in the past 24 hours. GRT/BTC pair saw a -1.80% decrease in the past 24 hours
Investing in The Graph, GRT will purely depend on your personal risk appetite. As you can see over the past 24 hours The Graph’s price has witnessed a -1.08% decrease and over the past 30 days The Graph has increase by 47.89%. So it all depends on if this investment will hit your trading goals.
According to our latest The Graph Price prediction for 2025, GRT should vary between $0.16 and $0.1. Please keep in mind that the crypto market is very volatile and this The Graph price prediction does not account for extreme wild swings in price.
As per the The Graph price prediction 2025 model above, GRT’s price for May 2025 should range between $0.1 to $0.16 with the average price for May being $0.13
According to the The Graph Price Prediction model above, GRT’s price in 2026 would be $0.15. This price would however would range from $0.19 and $0.12.
According to the The Graph Price Prediction model above, GRT’s price in 2027 would be $0.18. This price would however would range from $0.21 and $0.14.
According to the The Graph Price Prediction model above, GRT’s price in 2028 would be $0.19. This price would however would range from $0.23 and $0.15.
According to the The Graph Price Prediction model above, GRT’s price in 2029 would be $0.24. This price would however would range from $0.29 and $0.19.
According to the The Graph Price Prediction model above, GRT’s price in 2030 would be $0.29. This price would however would range from $0.35 and $0.23.
According to the The Graph Price Prediction model above, GRT’s price in 2031 would be $0.33. This price would however would range from $0.39 and $0.26.
According to the The Graph Price Prediction model above, GRT’s price in 2032 would be $0.42. This price would however would range from $0.51 and $0.34.
According to the The Graph Price Prediction model above, GRT’s price in 2033 would be $0.4. This price would however would range from $0.48 and $0.32.
According to the The Graph Price Prediction model above, GRT’s price in 2034 would be $0.55. This price would however would range from $0.67 and $0.44.
According to the The Graph Price Prediction model above, GRT’s price in 2035 would be $0.47. This price would however would range from $0.56 and $0.37.
According to the The Graph Price Prediction model above, GRT’s price in 2036 would be $0.61. This price would however would range from $0.73 and $0.48.
The highest price for The Graph was recorded in 12 February 2021 during which GRT hit an All Time High of $2.84
The price of 1 The Graph according to current market rate is $0.11


