
XRP hits new market cap milestone, flips Tether USDT on the rankings

Bitcoin’s price has gone past multiple ATHs over the past two months, with its ATH of $58,640 being the latest one. However, the last 7 days haven’t been the best of times for the world’s largest cryptocurrency, with its price dropping to $45k before recovering to trade around the $47.5k-range at press time. While Bitcoin’s price aspirations in the long term remain unquestionable, are investors confident of the asset in the short-term is a relevant question to ask yourself given the current market sentiment.
In an earlier article, it was observed that an emerging trend that has become all the more evident this market cycle involves the key role BTC whales are playing in determining the market’s direction. The data analyzed highlighted how over 100 whale accounts exited the BTC market over the past few weeks after the price climbed to its ATH, before correcting as a result of the sellers in the market.
This was further backed up by Glassnode after its data highlighted how the Bitcoin supply held by large addresses with a BTC balance ranging from 1k – 10k has dipped.
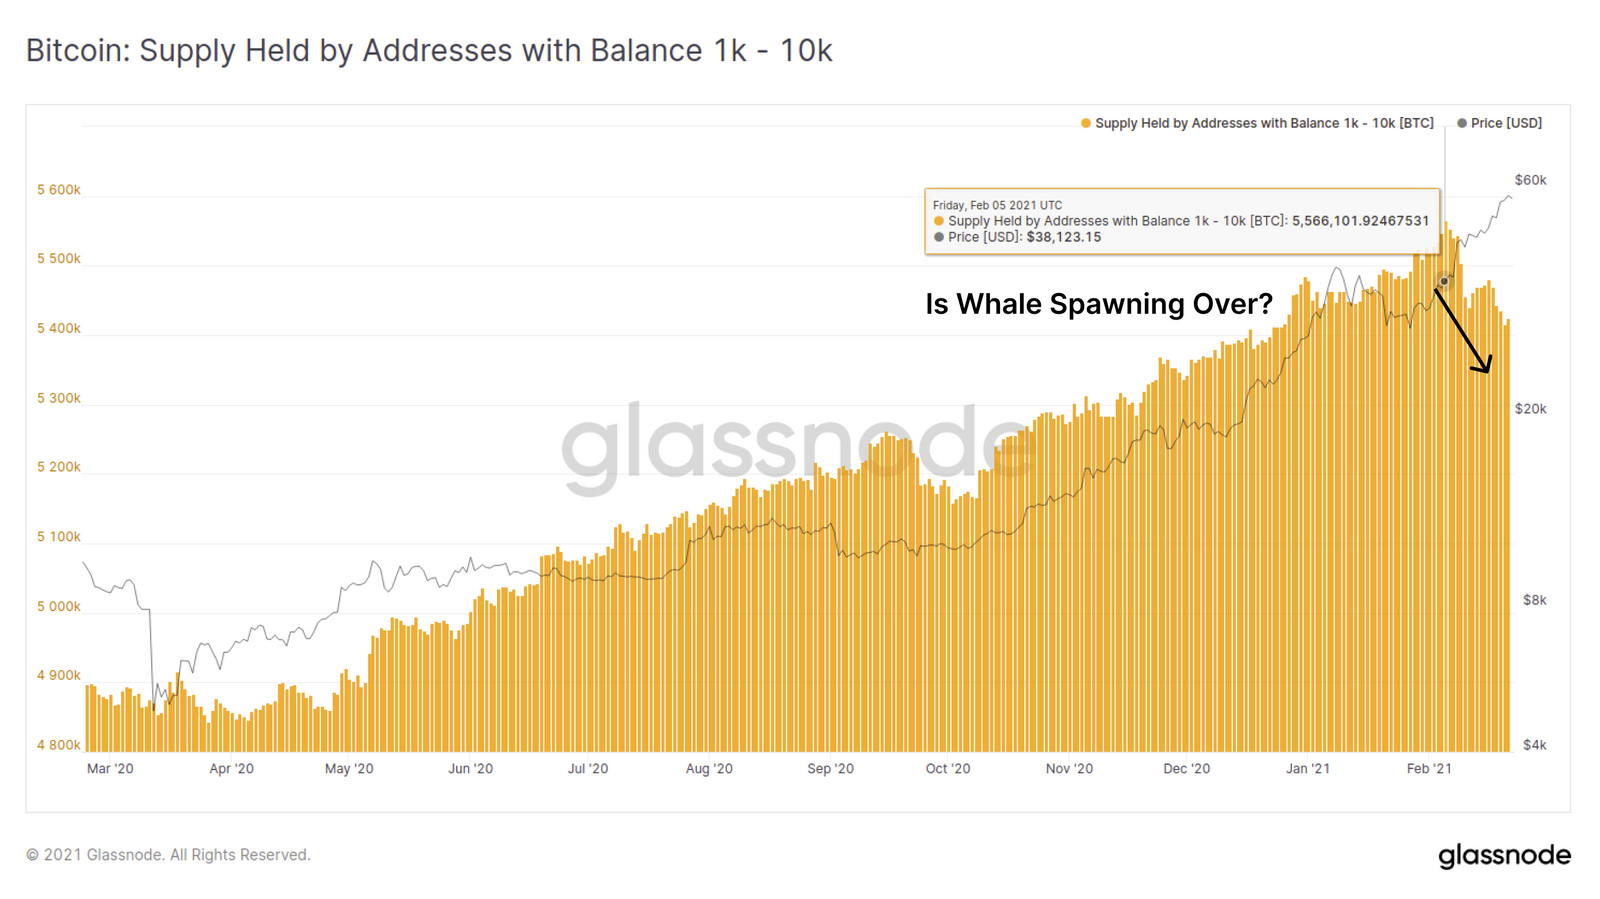
Source: Glassnode
However, this doesn’t necessarily mean that large accounts including institutions are now losing confidence in BTC and are now entering the seller’s market. On the contrary, this is characteristic of Bitcoin’s market cycle. This was evidenced by long-term holder sentiment since it portrays a better and clearer picture of what BTC’s prospects look like in the long run. A way to determine this includes looking at how much confidence investors have in the BTC market.

Source: Glassnode
Taking a look at Glassnode’s market data on Hodler net position change can serve as a good way to understand the coin’s long-term prospects. According to the same, confidence in the continuation of the Bitcoin bull market, despite the current pullback, is quite high, even when compared to previous price corrections in January 2021.
The negative values on the chart indicate hodlers cashing out and taking profits when the price of BTC falls. In January for instance, the altcoin fell to a low of around $30k, with Glassnode observing that a high percentage of hodlers were more inclined to sell at that price range.
When comparing the said data to the present price correction, it can be observed that the position change, while still negative, is quite negligible, implying that a significant number of long-term hodlers are continuing to back the coin, increasing the likelihood of a recovery run in the short-term.

Source: Glassnode
Additionally, the amount of illiquid Bitcoin supply on the network has grown more than the circulating supply since 2017 by a significant margin. When coupled with the hike in demand from institutions over the past 10 months, the shortage is going to work in favour of the coin and boost its price.
When talking about Bitcoin’s price, it is often compared to the momentum it enjoyed back in 2017. After all, this was the Bitcoin bull run that put it in the spotlight. However, the aforementioned metrics also highlight why this bull cycle is not as short-lived as the 2017 bull run and why the bears have been largely out of the picture, unlike in the months that followed December 2017.


