
Bitcoin Cash broke out of an ascending triangle pattern and had a technical target of $680. IOTA was unable to climb above the $1.4 mark and Enjin Coin could see a dip to $1.8.
Source: CoinStats
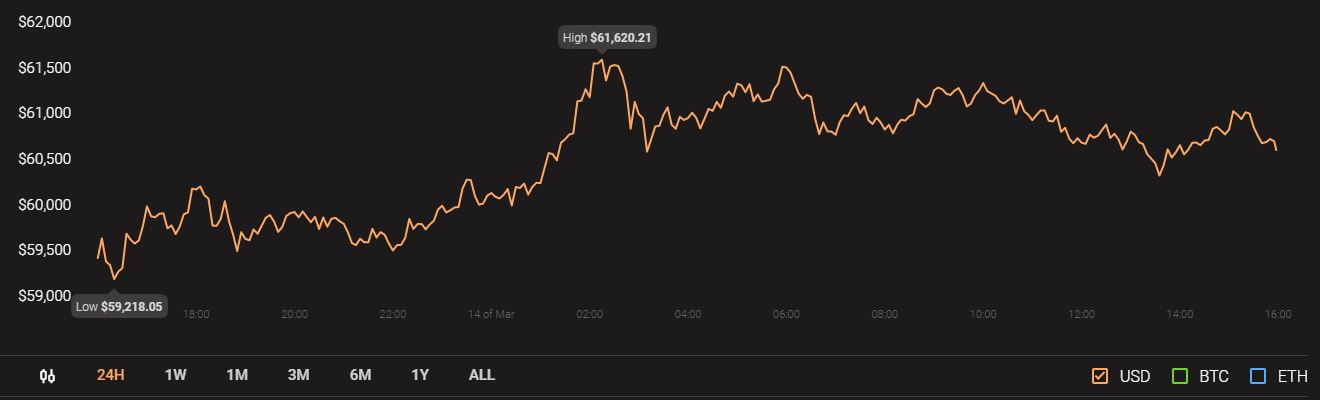
Meanwhile, Bitcoin was trading at $60620 with a 24-hour trading volume of $54.5 billion.
Bitcoin Cash [BCH]
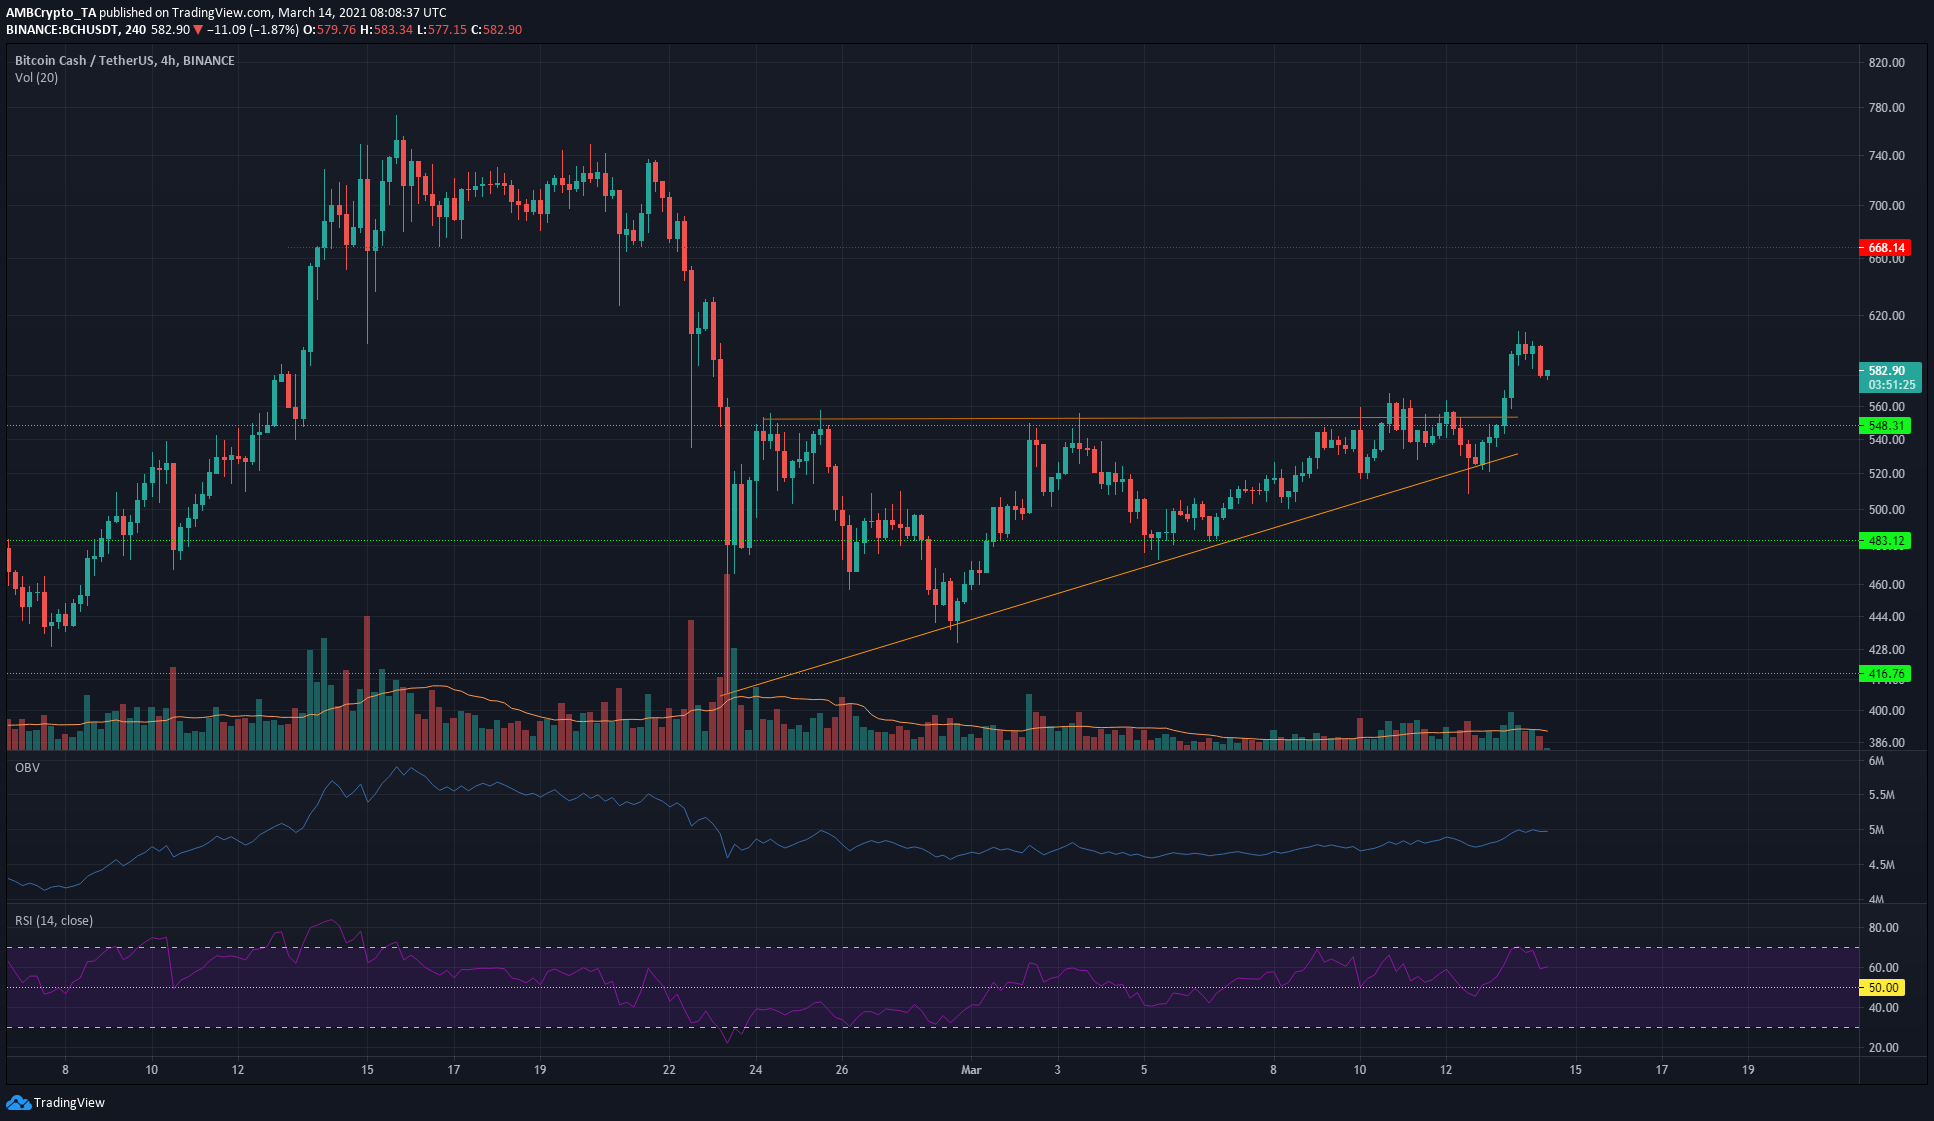
Source: BCH/USDT on TradingView
BCH broke out on strong trading volume to touch $600 and saw a minor pullback to trade at $580 at the time of writing. The RSI was at 60 to show bullish momentum. Over the past week, the OBV has slowly trended upward, indicating that buyers were beginning to outweigh the sellers.
The $600-$610 and $625-$635 are areas that could offer resistance to the price beneath the $668 resistance level.
IOTA
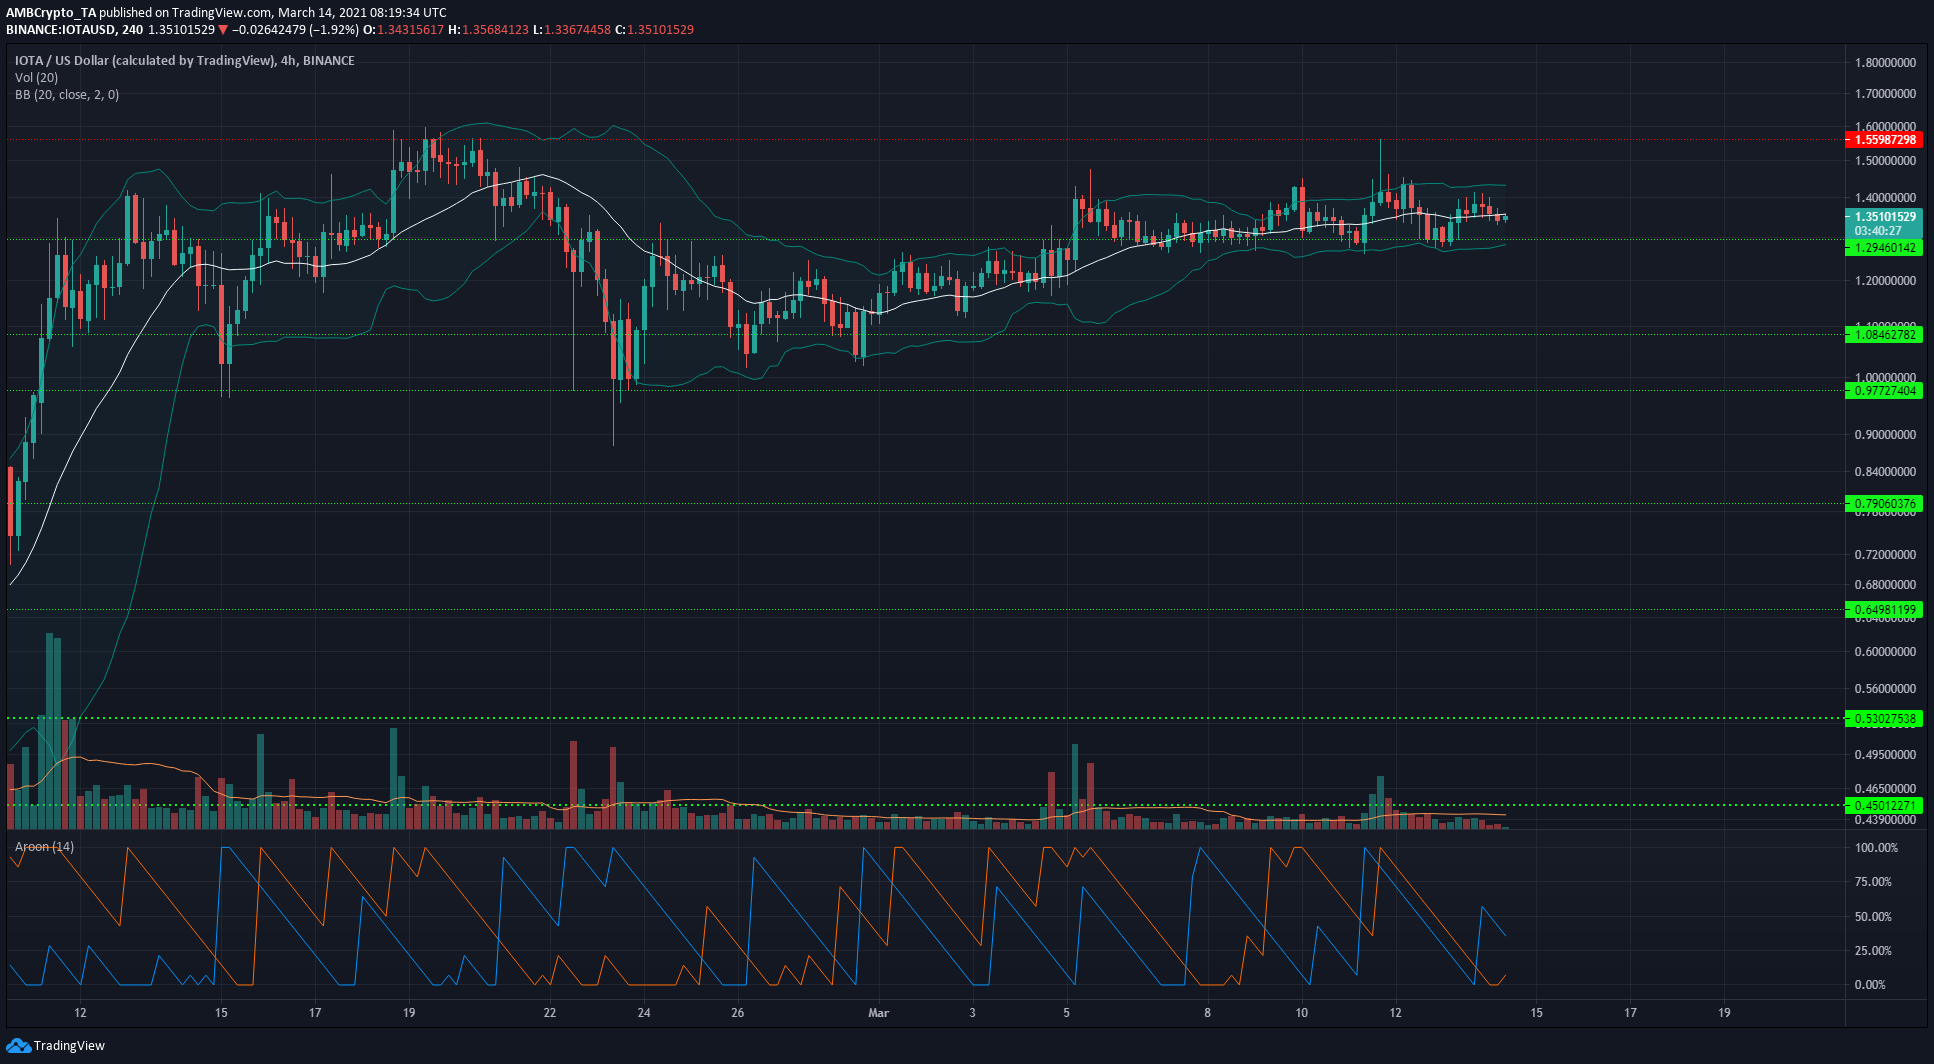
Source: IOTA/USD on TradingView
IOTA ascended past the $1.29 level with heavy trading volume ten days ago but since then its upward momentum has been dampened. IOTA has been in a consolidation phase just above the $1.3 mark, with the $1.4 area acting as resistance as the price bounced between these two levels.
The Bollinger Bands on the 4-hour charts highlight the relatively low volatility around IOTA since it climbed above $1.3. The Aroon indicator showed the Aroon Up and Down lines crisscrossing each other, to show no trend was established yet. Levels of importance are $1.3, $1.4, and $1.55.
Enjin Coin [ENJ]
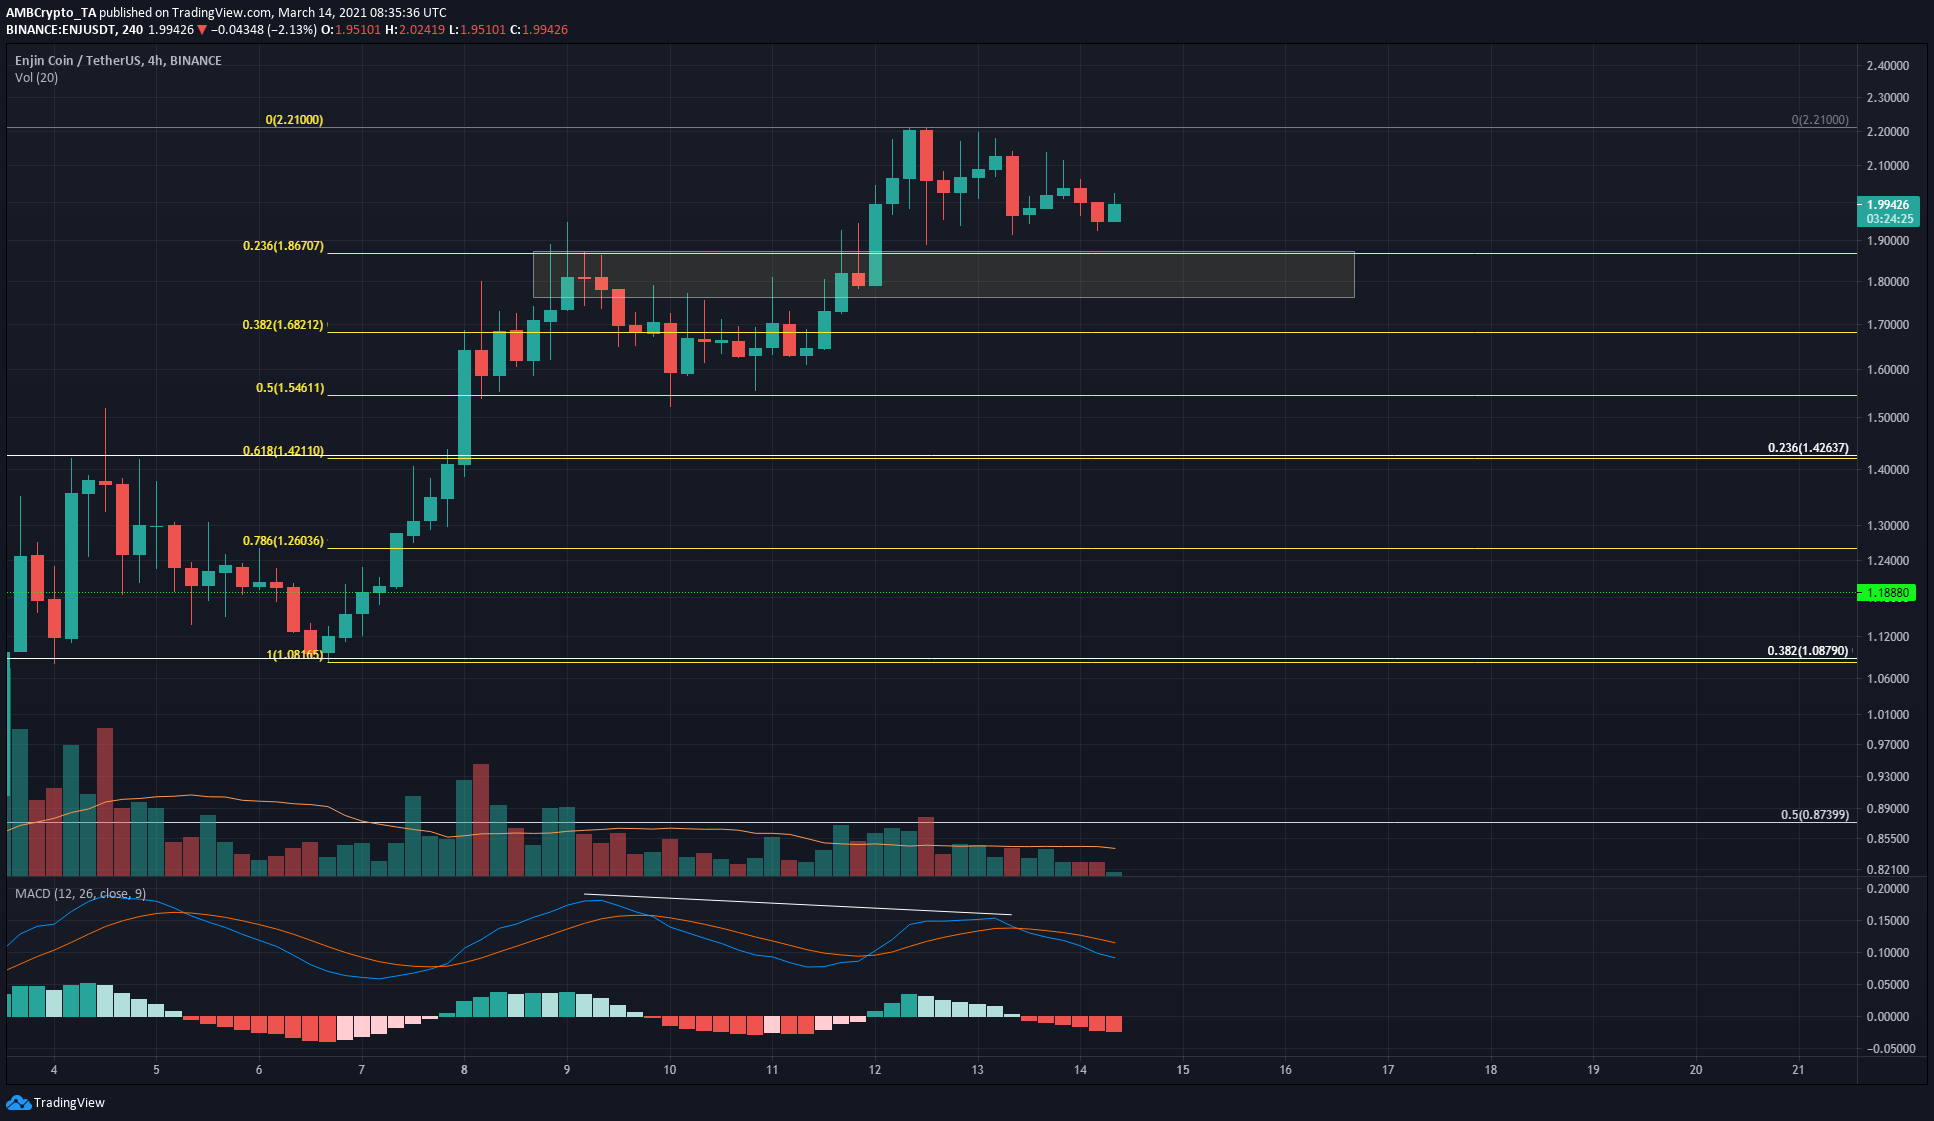
Source: ENJ/USDT on TradingView
The MACD formed a lower high even as ENJ prices formed a higher high. This bearish divergence has already begun to play out, and it likely to see ENJ pullback to the $1.78-$1.86 region before its next move upward.
Two sets of retracement levels were used for two different price movements of ENJ in an attempt to find imminent levels of support. In yellow is the shorter-term surge for ENJ, and it shows that its 61.8% retracement level lies at $1.42, which has confluence with the 23.6% retracement level from a longer-term move (white).
This showed that a move below $1.42 is a signal of weakening bullish momentum in the longer timeframes.
However, at the time of writing, the $1.8 area is the important short-term region of demand that bulls would look to defend should selling pressure increase.