
The altcoin market was, for the most part, following the movements of Bitcoin, at press time. Bitcoin Cash attempted to climb past $560 once more and could see a breakout in the coming hours. On the contrary, Ethereum Classic was trading within the $11.9-$12.2 zone, while VeChain could see some recent gains retraced.
Bitcoin Cash [BCH]
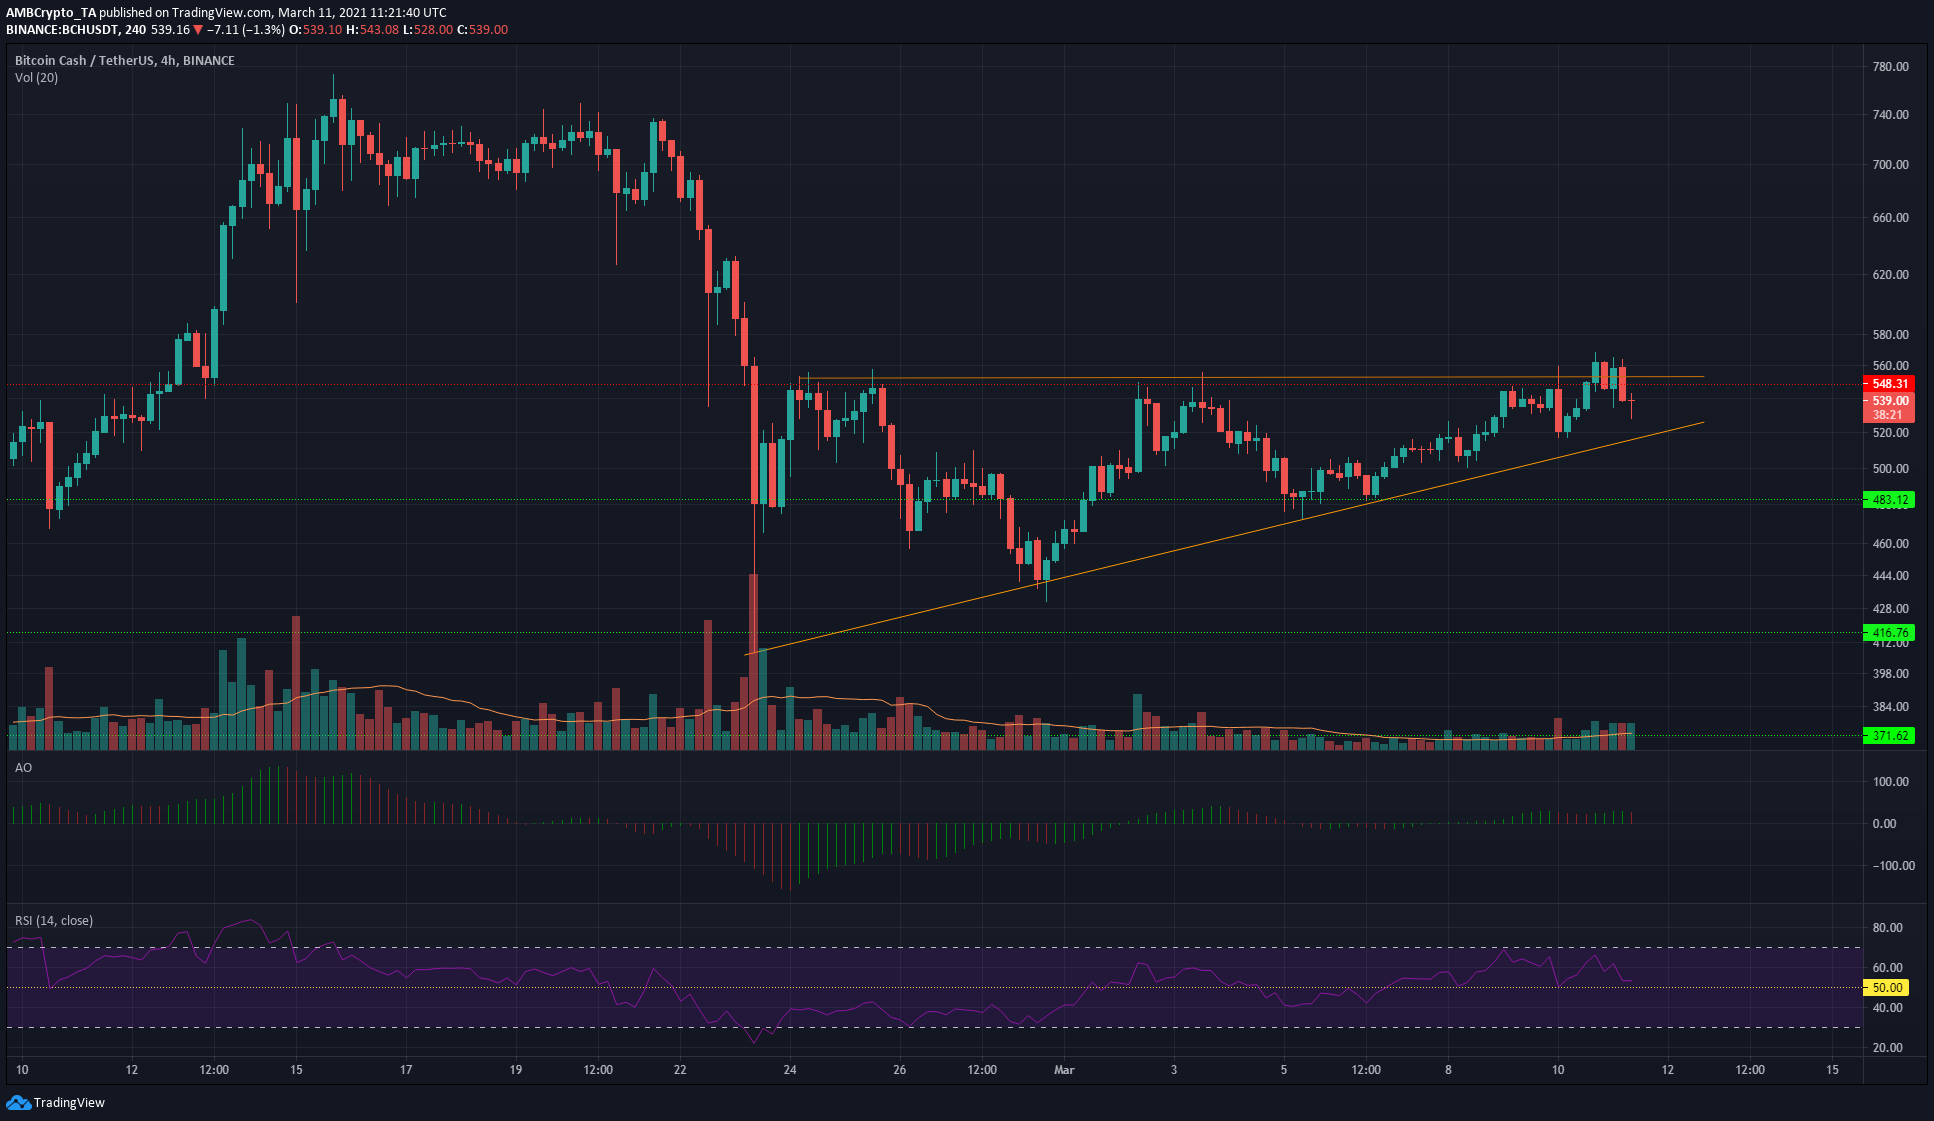
Source: BCH/USDT on TradingView
Bitcoin Cash appeared to form an ascending triangle pattern on the charts. A breakout past the stiff resistance at $550-$560 could see BCH move north to touch $700 once more. However, such a move will also be closely related to how Bitcoin reacts at the $56,400-level.
The RSI on the 4-hour chart suggested that bullish momentum was behind BCH over the past few days, with the indicator well above 50 at press time. Further, the trading volume was not trending higher or lower, indicating that the market sentiment was not yet strong enough to force a significant move in either direction.
Ethereum Classic [ETC]
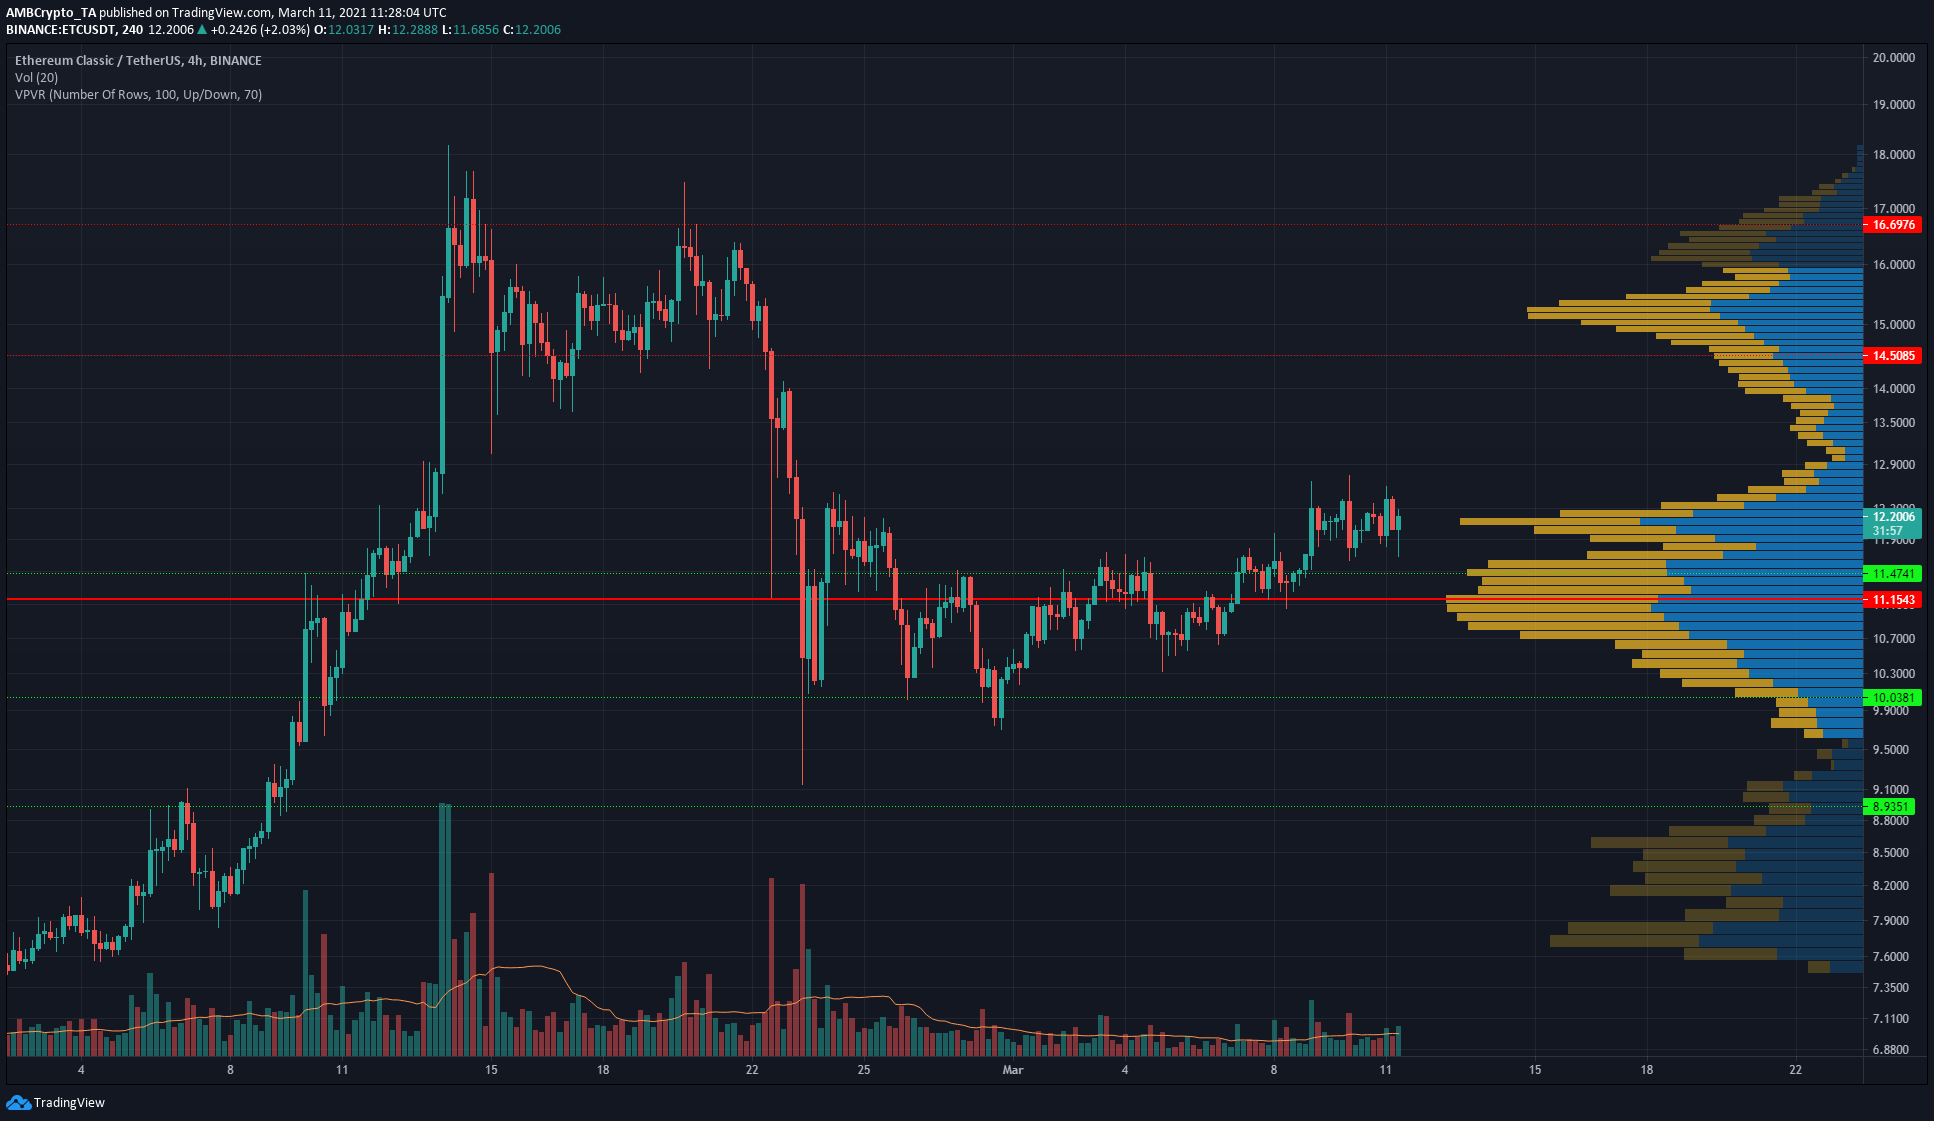
Source: ETC/USDT on TradingView
The Volume Profile Visible Range showed some key areas of strong trading activity which are likely to act as areas of supply and demand in the near-term. The Point of Control lay at $11.15, a level the price retested as support. Since then, it has also managed to rise above the $11.47-mark.
Again, the VPVR suggested that the $12.2 and $15-zones were ones that saw heavy trading activity over the past month. Above $12.2, there seemed to be a dearth of activity, with the price likely to surge straight to $14 should it ascend past $12.3.
VeChain [VET]
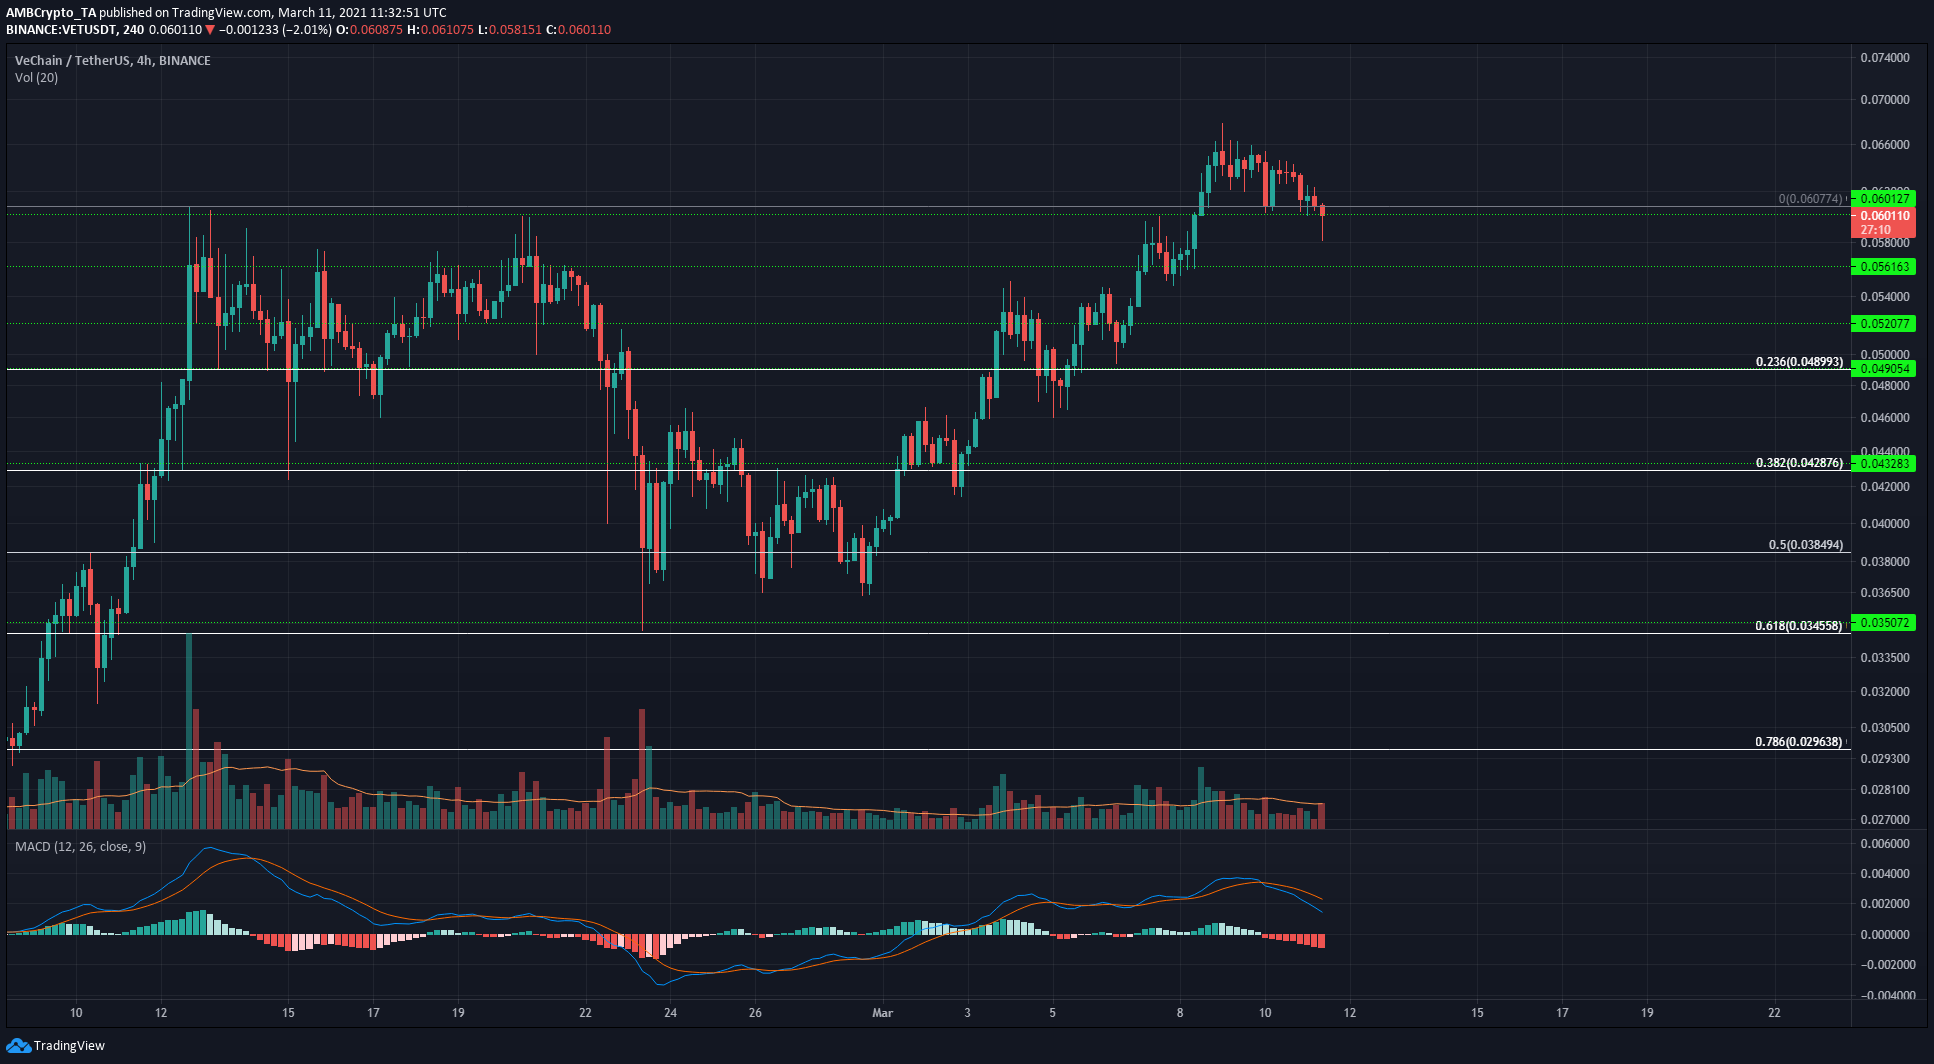
Source: VET/USDT on TradingView
VeChain registered a pullback to the $0.0385-level and since then, has made steady gains and flipped multiple levels of former resistances to supports. At the time of writing, the price was heading towards the $0.06-mark once more.
The MACD formed a bearish crossover on the 4-hour charts to show rising bearish momentum. This could take VET to the $0.056-level of support in the coming days. This was not a signal of a trend reversal, however, and lower support levels should be looked at as possible buying opportunities.