
Disclaimer: The findings of the following analysis are the sole opinions of the writer and should not be taken as investment advice
XRP climbed past the $0.5-mark last week, with the crypto staying well above the $0.51-level of support. At the time of writing, it was at the end of a surge from $0.53 to $0.58. In the short-term, XRP could register further gains, despite the fact that Ripple and SEC continue to be entangled in a lawsuit that recently saw the latter file an amended complaint.
XRP 30-minute chart
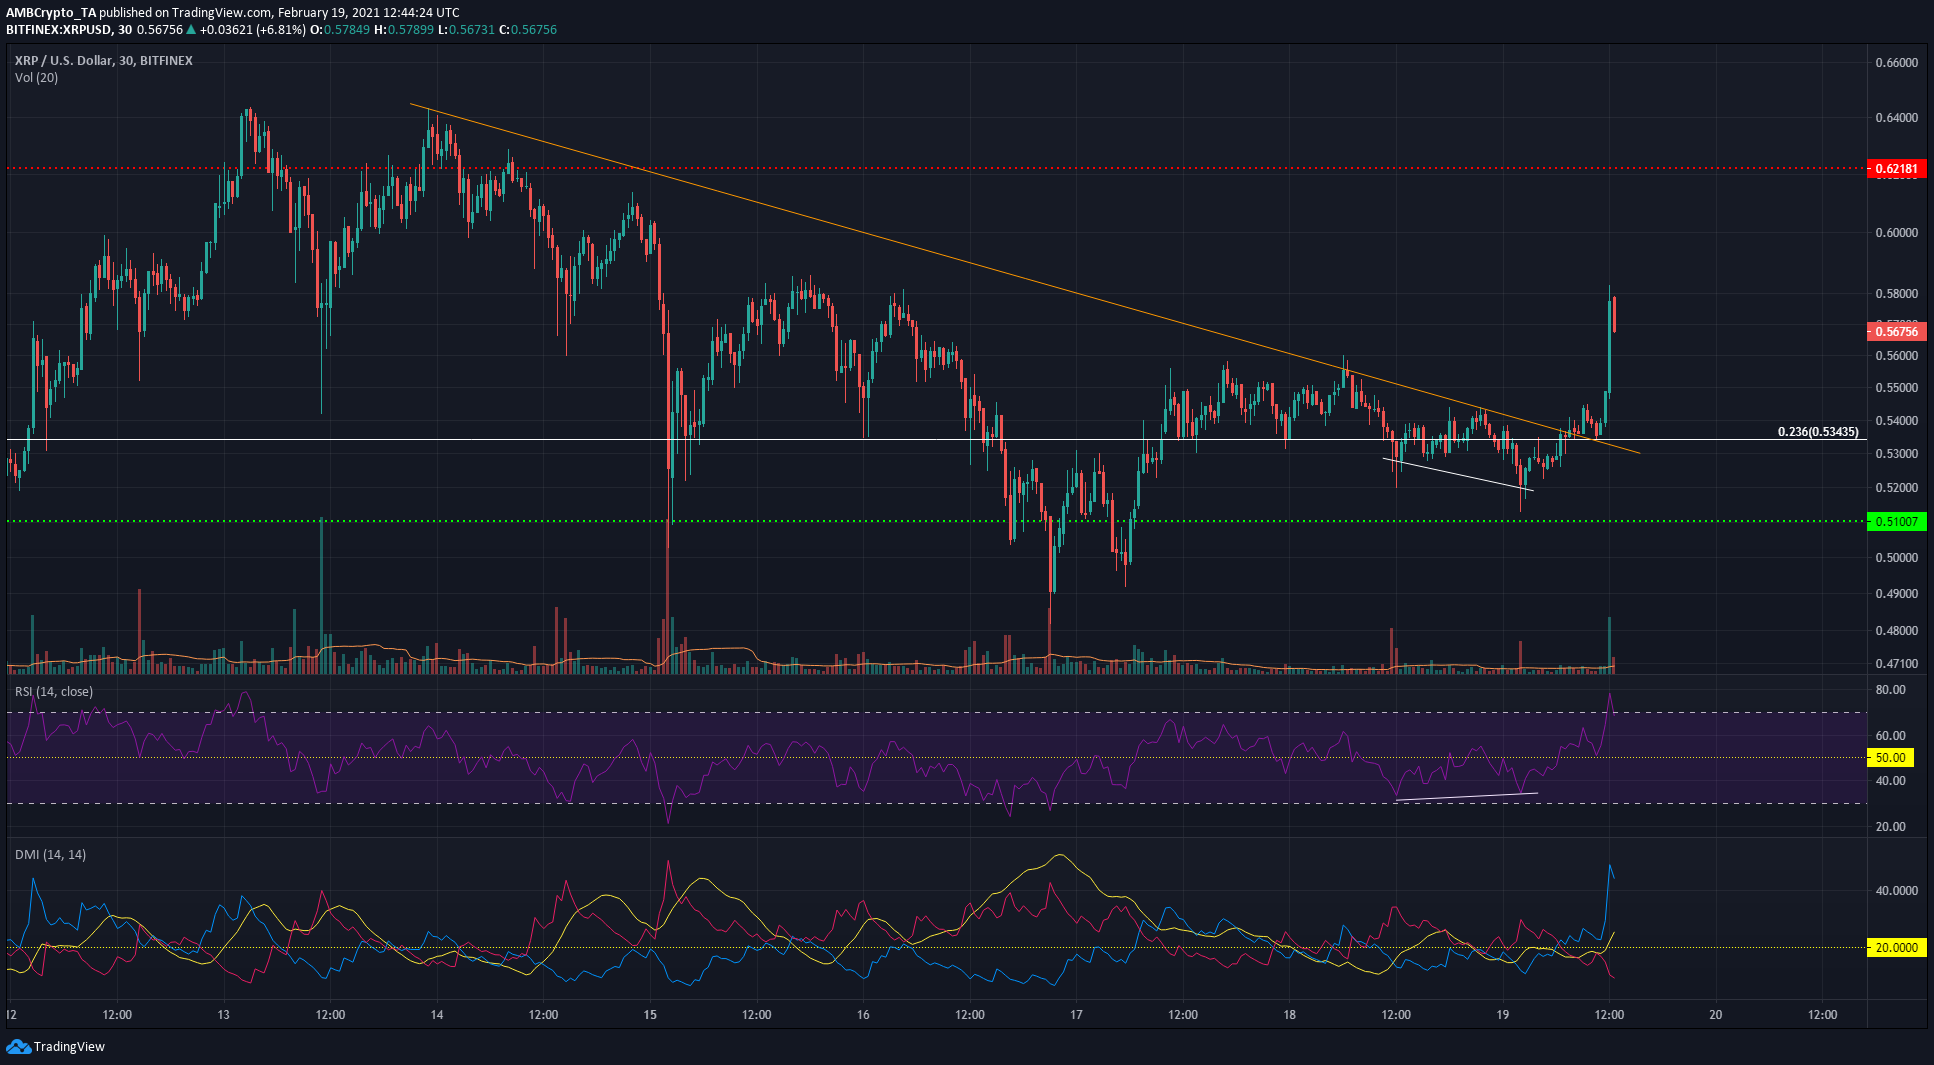
Source: XRP/USD on TradingView
XRP broke out past its descending trendline backed by strong volume. It used the Fibonacci retracement level at $0.53 as support and sprang upwards to reach $0.582. At the time of writing, XRP saw some selling, but the trading session in question had not yet finished. The $0.57-$0.58 region and the $0.62-level were the next significant areas of resistance for XRP’s bulls, following a breakout to the upside.
Over the last 7 days, XRP has trended steadily lower on the charts. The $0.53-retracement level briefly gave in as the price slipped under $0.51, but the market’s buyers were able to force the prices higher.
A buying opportunity in the short-term would arise if XRP closes a trading session above $0.58 while flipping the $0.57-$0.58 area to one of demand.
Market Rationale
The RSI underlined the formation of a bullish divergence (white), with the price subsequently finding support at $0.53 after a brief dip under it. However, the divergence, combined with mounting trading volume, gave buyers conviction that a breakout was imminent, with XRP moving higher to close the session at $0.58.
The Directional Movement Index also suggested that a bullish event of significance had taken place. The ADX (yellow) rose above the neutral 20 value as +DI (blue) also shot upwards.
Finally, the RSI rose above 50, retesting it as support before moving higher.
These findings painted a bullish picture for XRP in the short-term, made stronger by the strength of its trading volume. However, the $0.55-$0.56 zone should serve as a region of demand. Henceforth, a dip under the same would indicate a move lower down the charts.
Conclusion
While a bullish breakout was seen, further buying opportunities would arise if the $0.57-$0.58 region sees some buyers step in. If trading volume starts to decline alongside the price, a revisit of $0.53 could be on the cards.