
XRP formed a triangle pattern that could see it push toward $1.5 again, while FTX Token continued to trend strongly upward. Although it could see a dip, FTT had strong demand driving its surge. Waves defended the $15.14 support level and is likely to consolidate over the next few days.
XRP
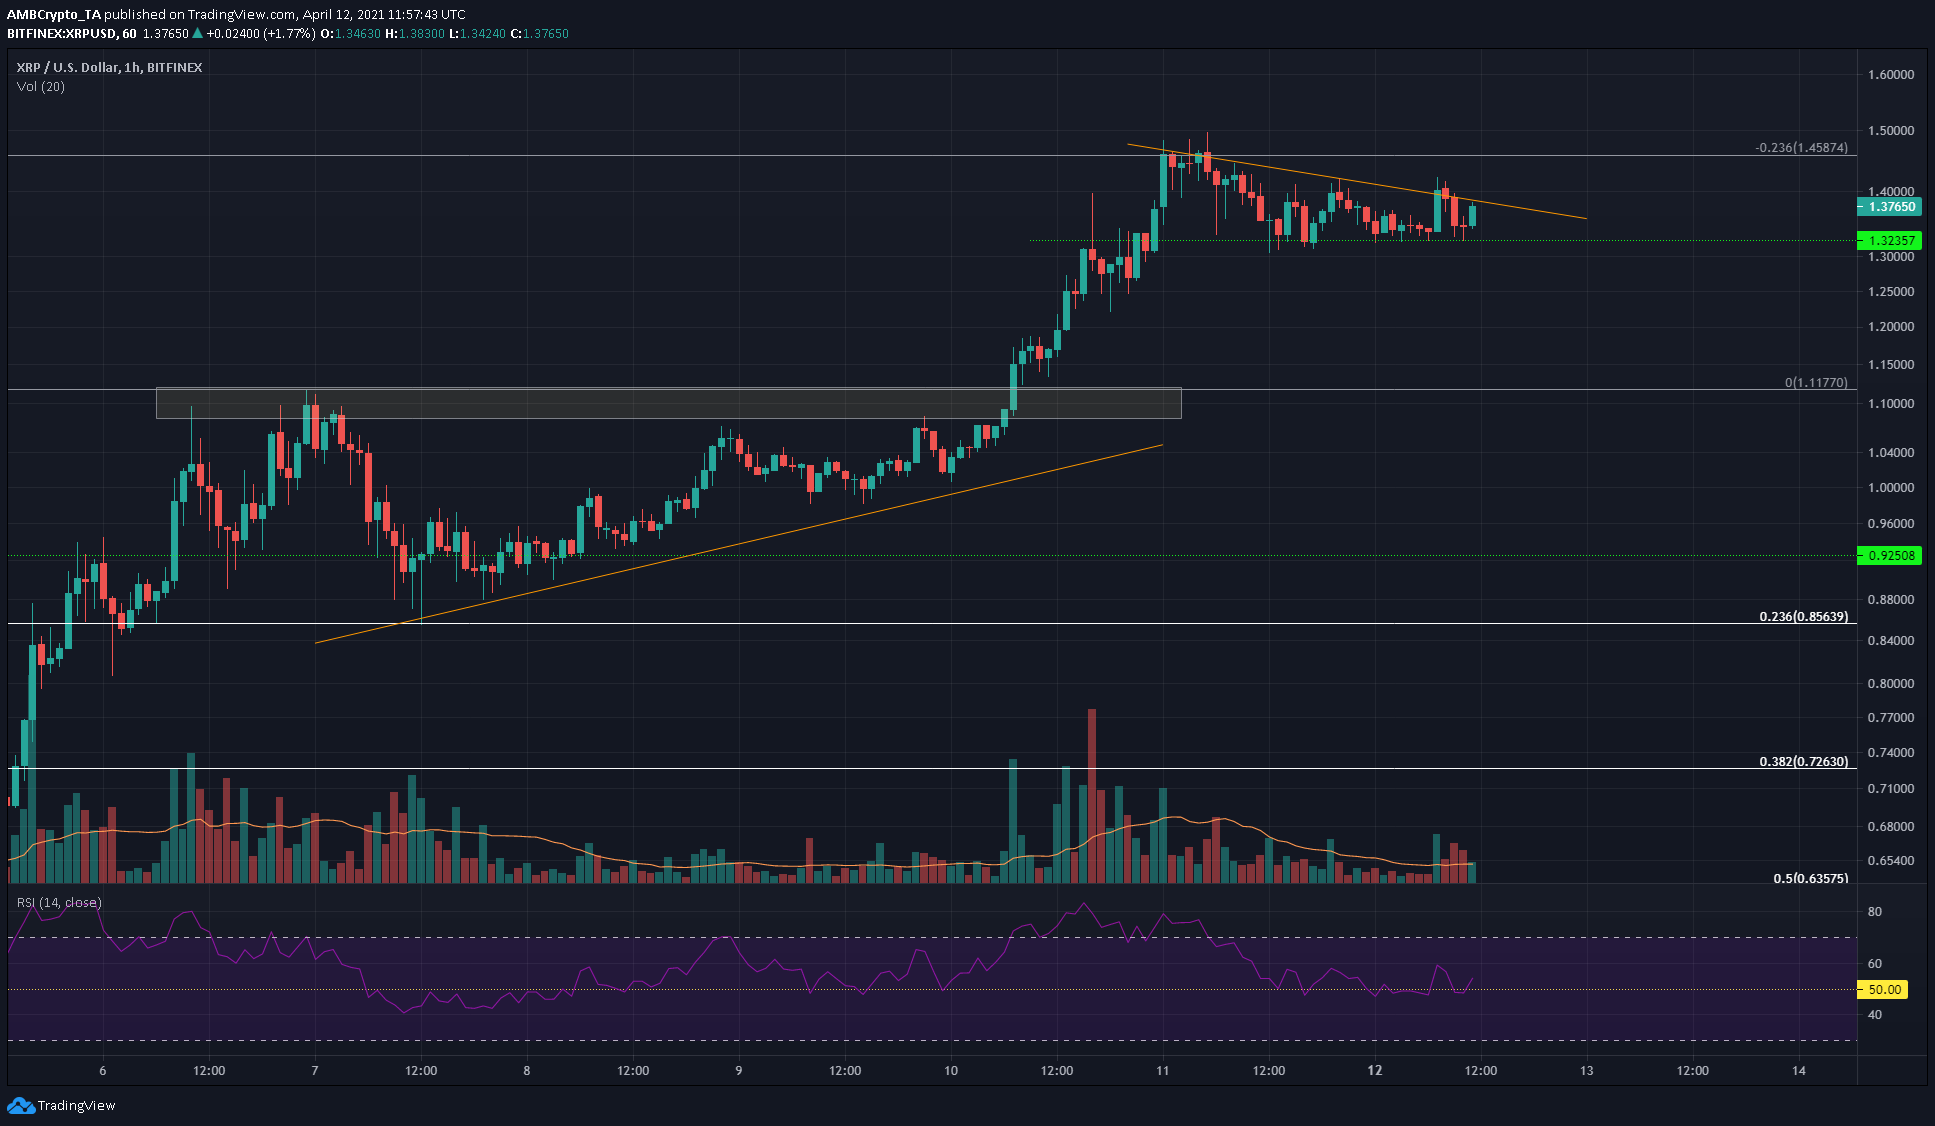
Source: XRP/USD on TradingView
XRP formed a descending triangle pattern, after breaking out past an ascending triangle pattern over the weekend. There was support at the $1.32 level and the RSI on the 1-hour chart was oscillating about neutral 50.
A break beneath support will take XRP to $1.18, while a move past the descending trendline will see XRP test the $1.5 mark in the hours to come. Heavy trading volume is necessary to fuel a move to either of these technical targets.
FTX Token [FTT]
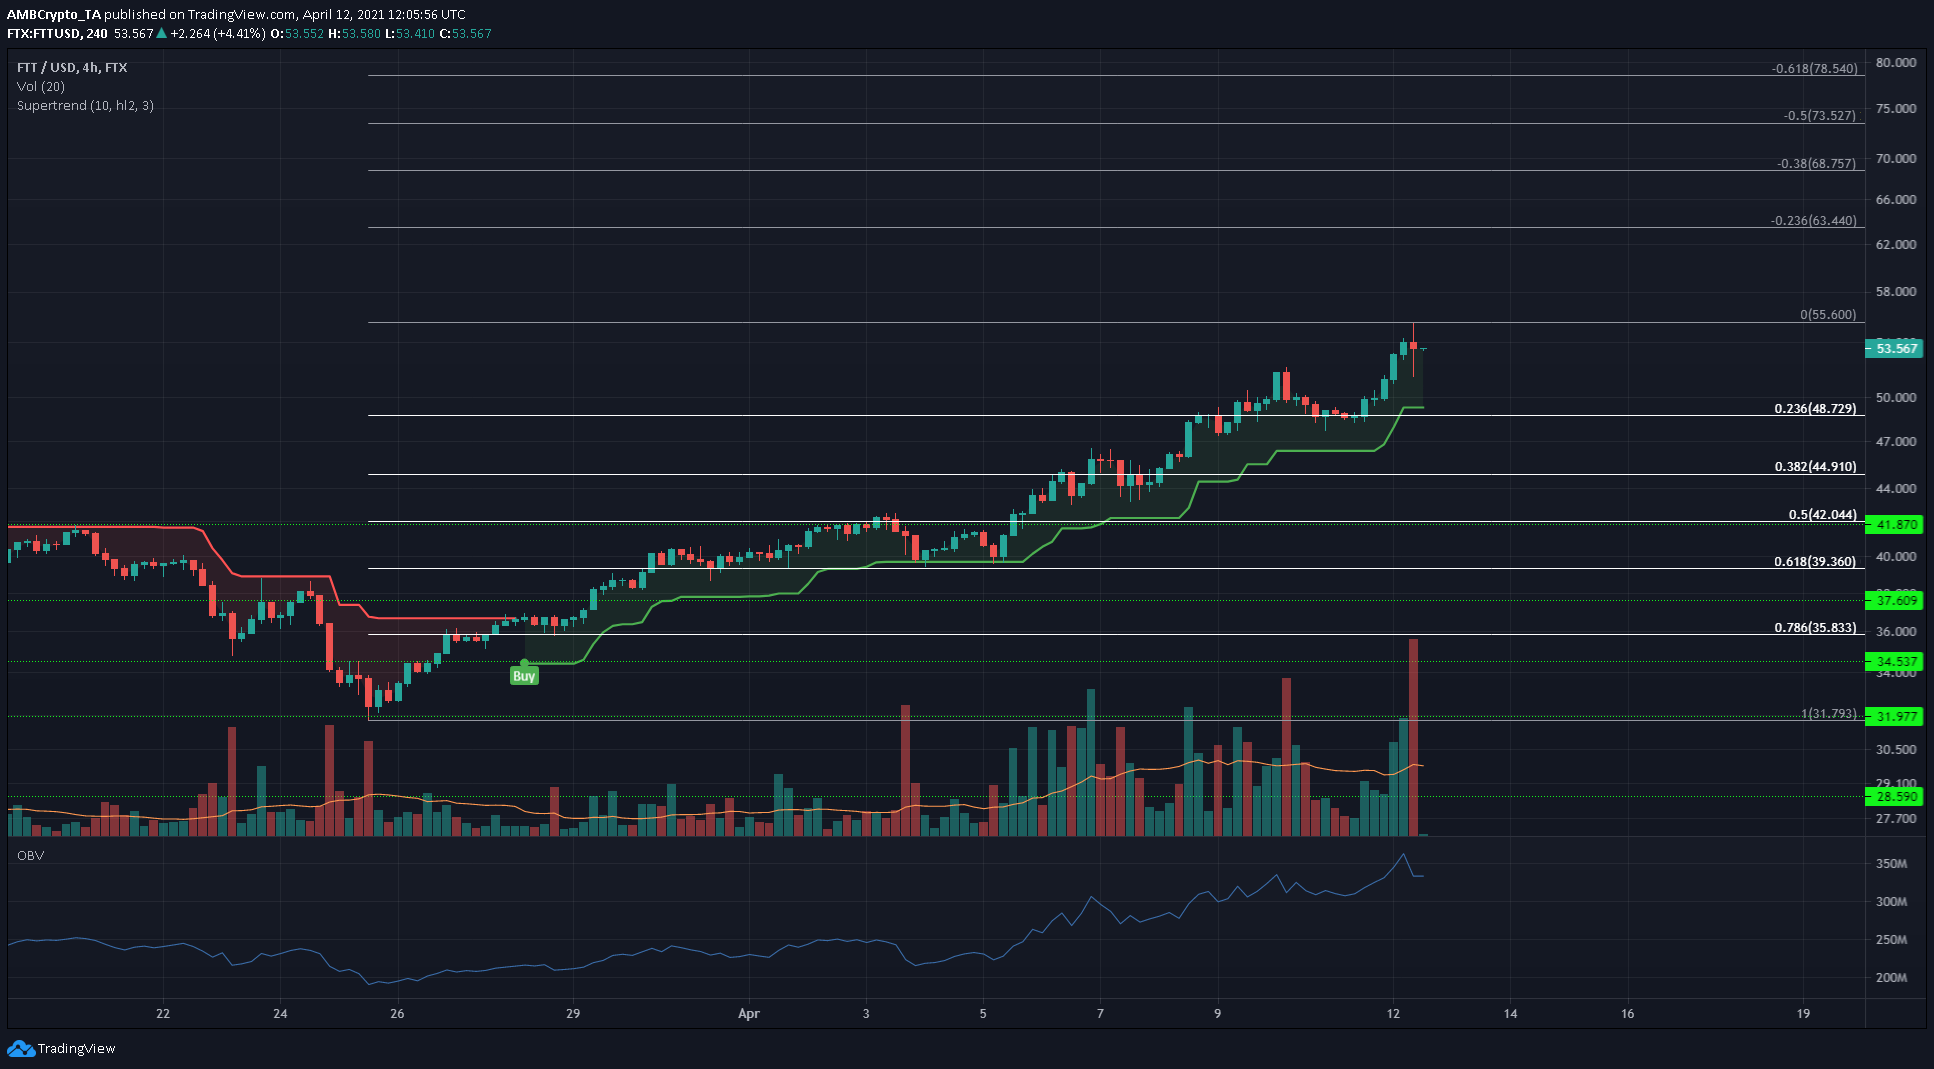
Source: FTT/USD on TradingView
FTT was in a strong uptrend once more. In the first week of March, FTT approached the $32 level with strong momentum, broke above it and reached a high of $42 before facing rejection, and was forced to test the $32 level as support. In the last week of March, FTT saw demand rise at the $32 mark, and this steady demand has driven FTT higher and higher up the charts, as the OBV has been forming higher lows.
The past few days saw FTT post a new ATH at $55.6, and some retracement levels have been plotted. The Supertrend indicator continued to give a buy signal that would be flipped to sell if FTT closed a session below $49.3. Past $55.6, some extension levels are plotted that could see some selling pressure arrive.
Waves [WAVES]
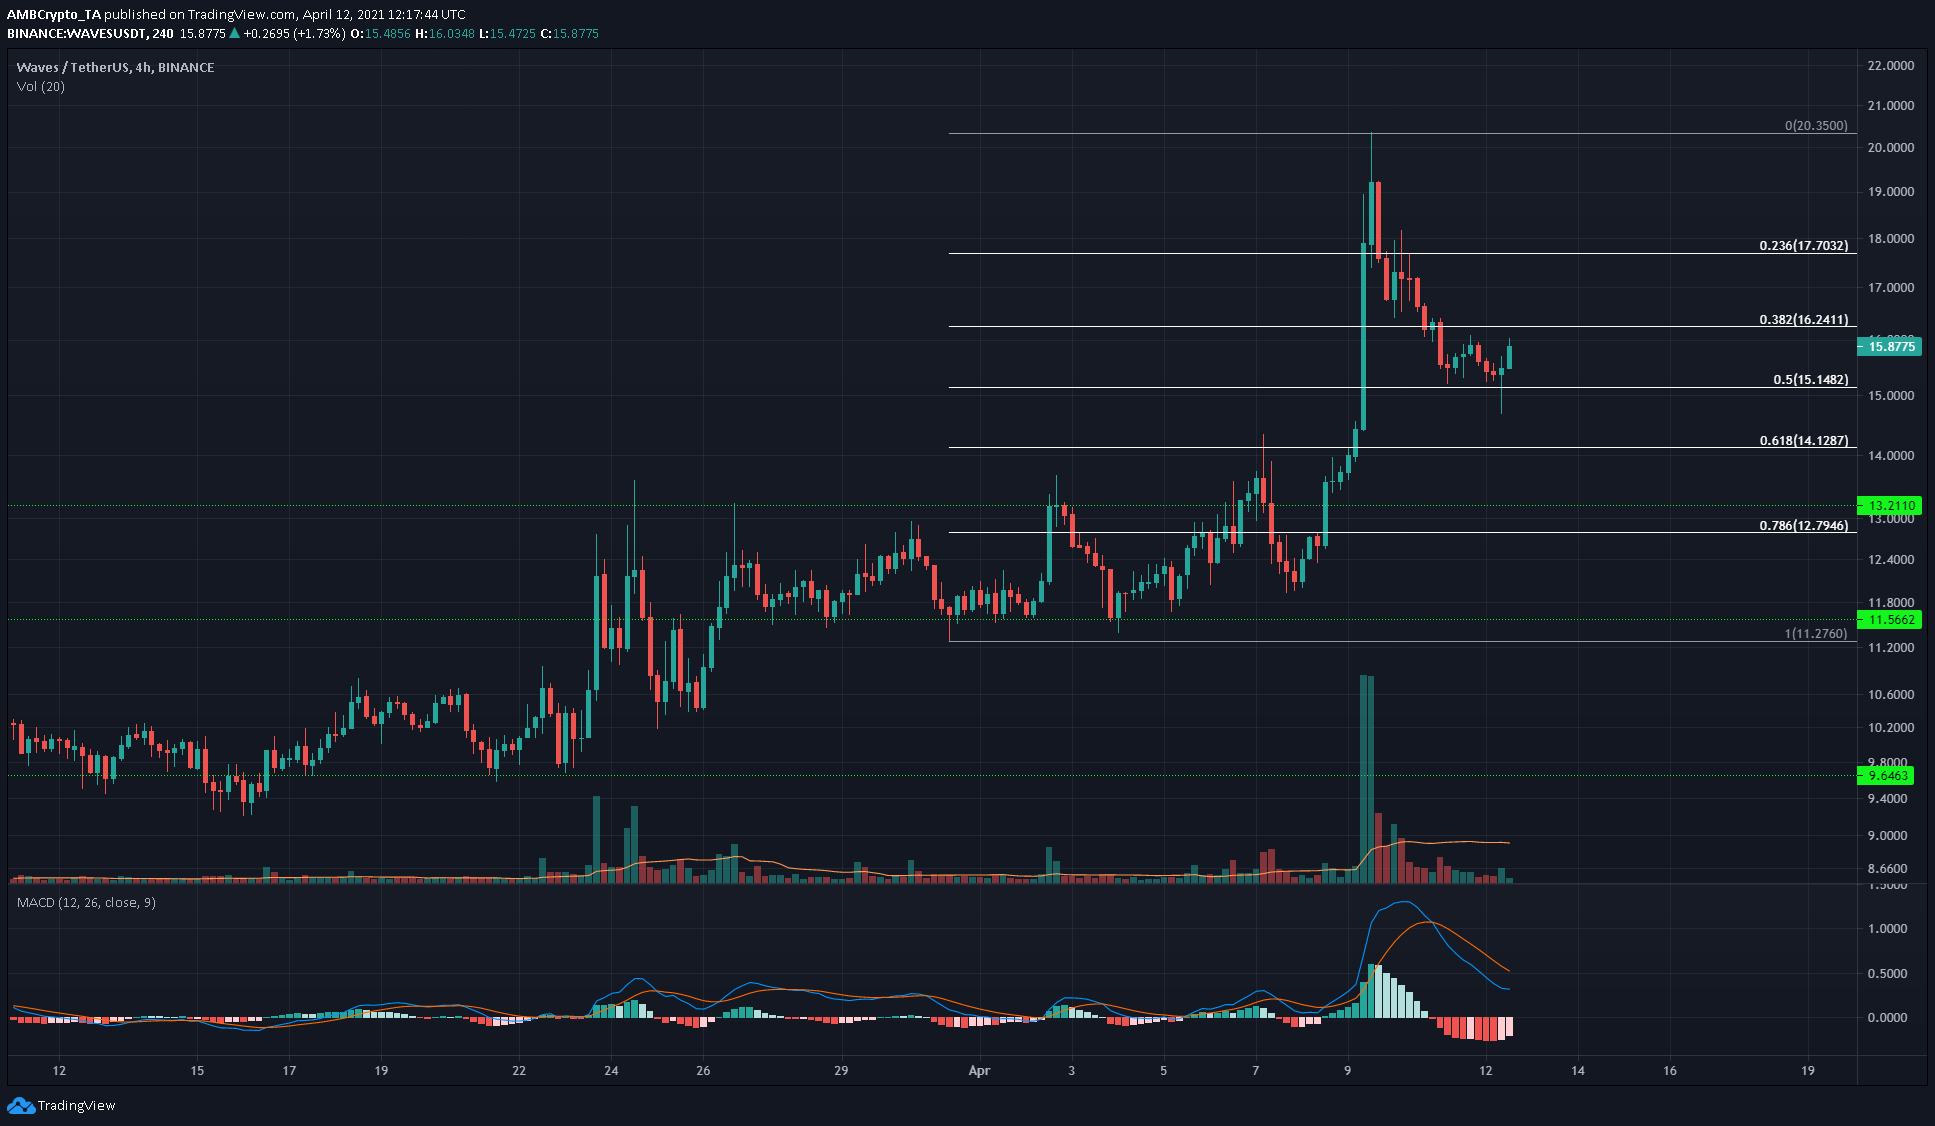
Source: WAVES/USDT on TradingView
WAVES retraced some of the gains it made over the past week. The price tested the $15.14 level, which is the 50% retracement level of the move from a swing low at $11.2 to a swing high at $20.35. Trading volume was extremely high during that surge but has receded back.
The MACD, although above the zero line, showed some bearish momentum was behind WAVES in the past couple of days. The distance between the MACD line (blue) and the signal line (orange) on the indicator suggested that the market was oversold in the short term.
The defense of the 50% level is likely to see WAVES form a range and consolidate in the days to come. Another aggressive push higher by the bulls is unlikely and the market would need some time to gather steam.


![Why Chainlink [LINK] and Polygon [MATIC] are more similar than you realise](https://ambcrypto.com/wp-content/uploads/2024/04/Chainlink_and_Polygon-1-400x240.webp)

