Analysis

XRP, Bitcoin SV, Elrond Price Analysis: 13 March
Posted:
| Last updated: January 30th, 2024

XRP was trading within a descending channel pattern and the buyers lacked the numbers to drive the prices toward a breakout. Elrond has been trading within $130 to $160 for a few days, while Bitcoin SV has been consolidating under the $192 level.
XRP
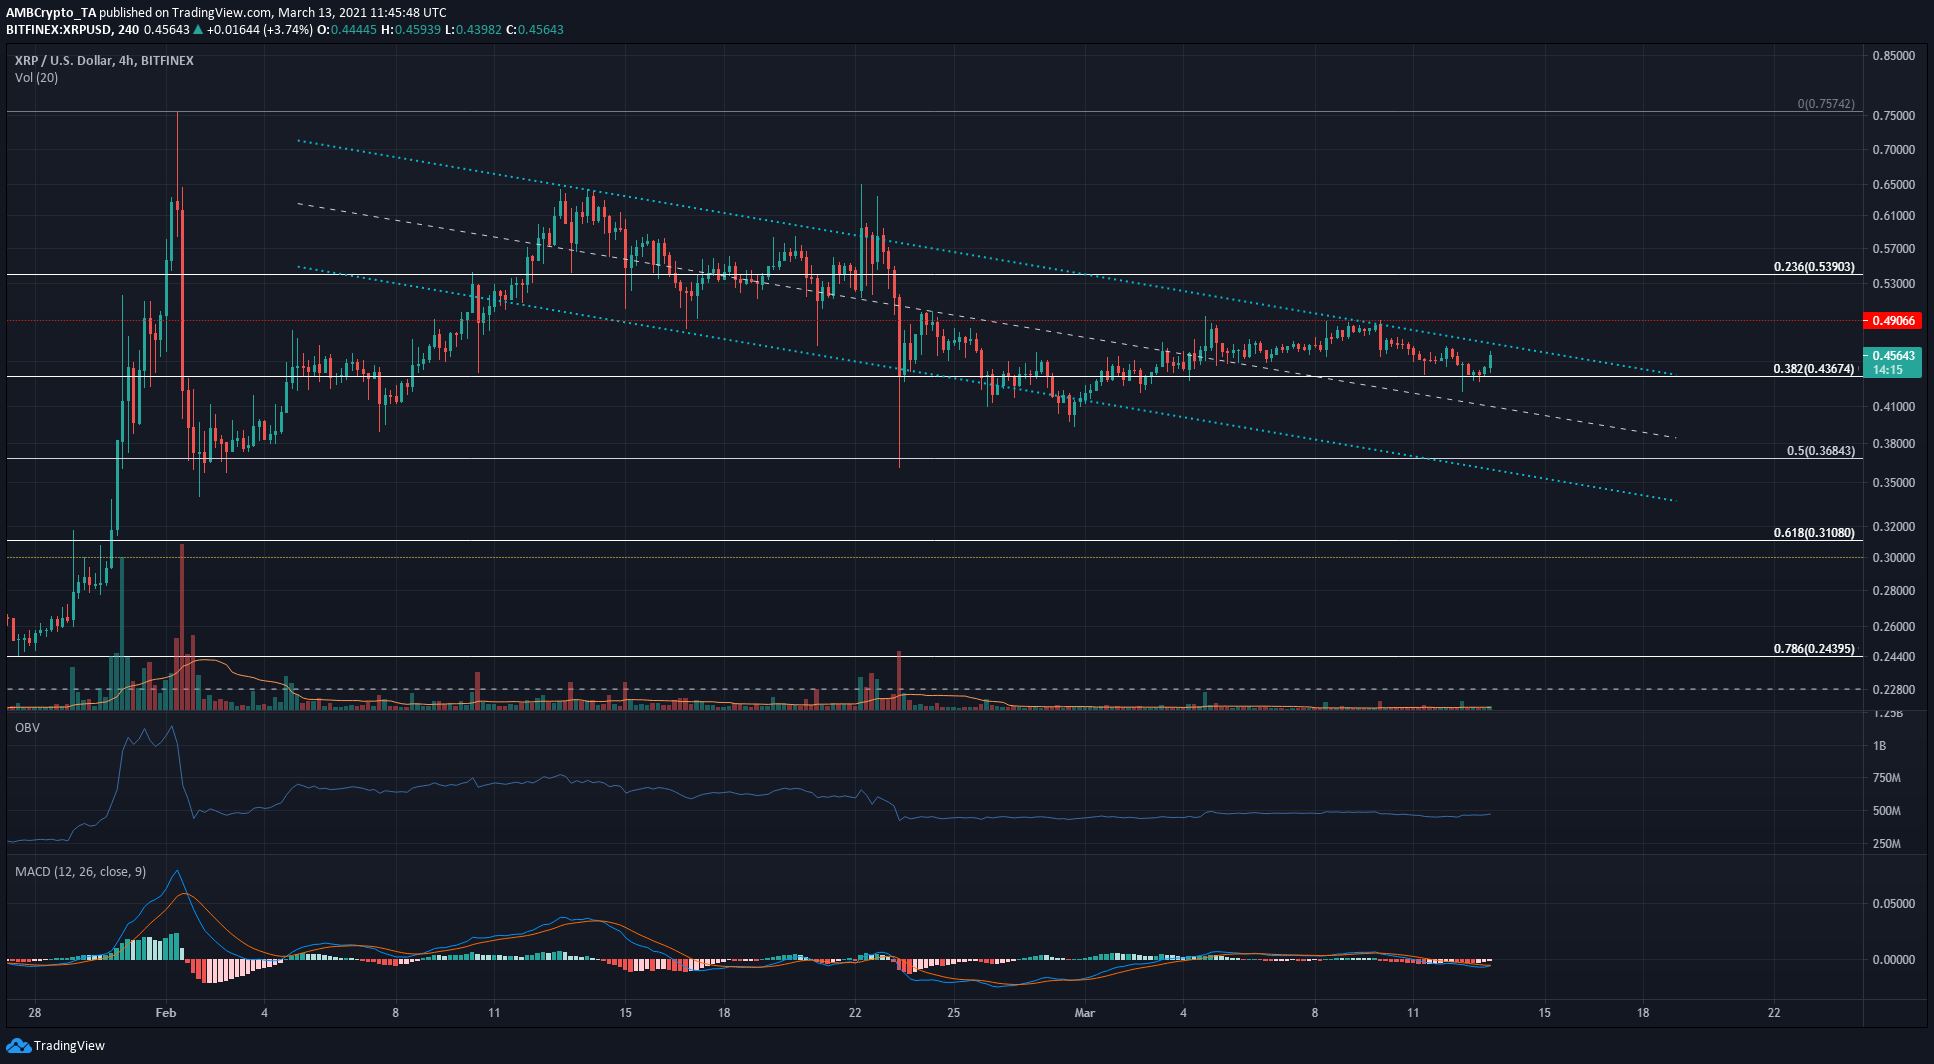
Source: XRP/USD on TradingView
The descending channel that XRP was trading within did not yet see a breakout, however, the $0.439 level of support was defended in recent hours. This level represents the 38.2% retracement level for XRP’s move from $0.179 to $0.75.
On the 4-hour chart, neither the momentum nor the buying volume was significant at the time of writing. The upper boundary of the descending channel, as well as the horizontal level of resistance at $0.49, is likely to offer significant resistance to XRP.
Moving above these levels would be a bullish development while dipping beneath the $0.439 could see XRP move toward the $0.4 mark over the next few days.
Bitcoin SV [BSV]
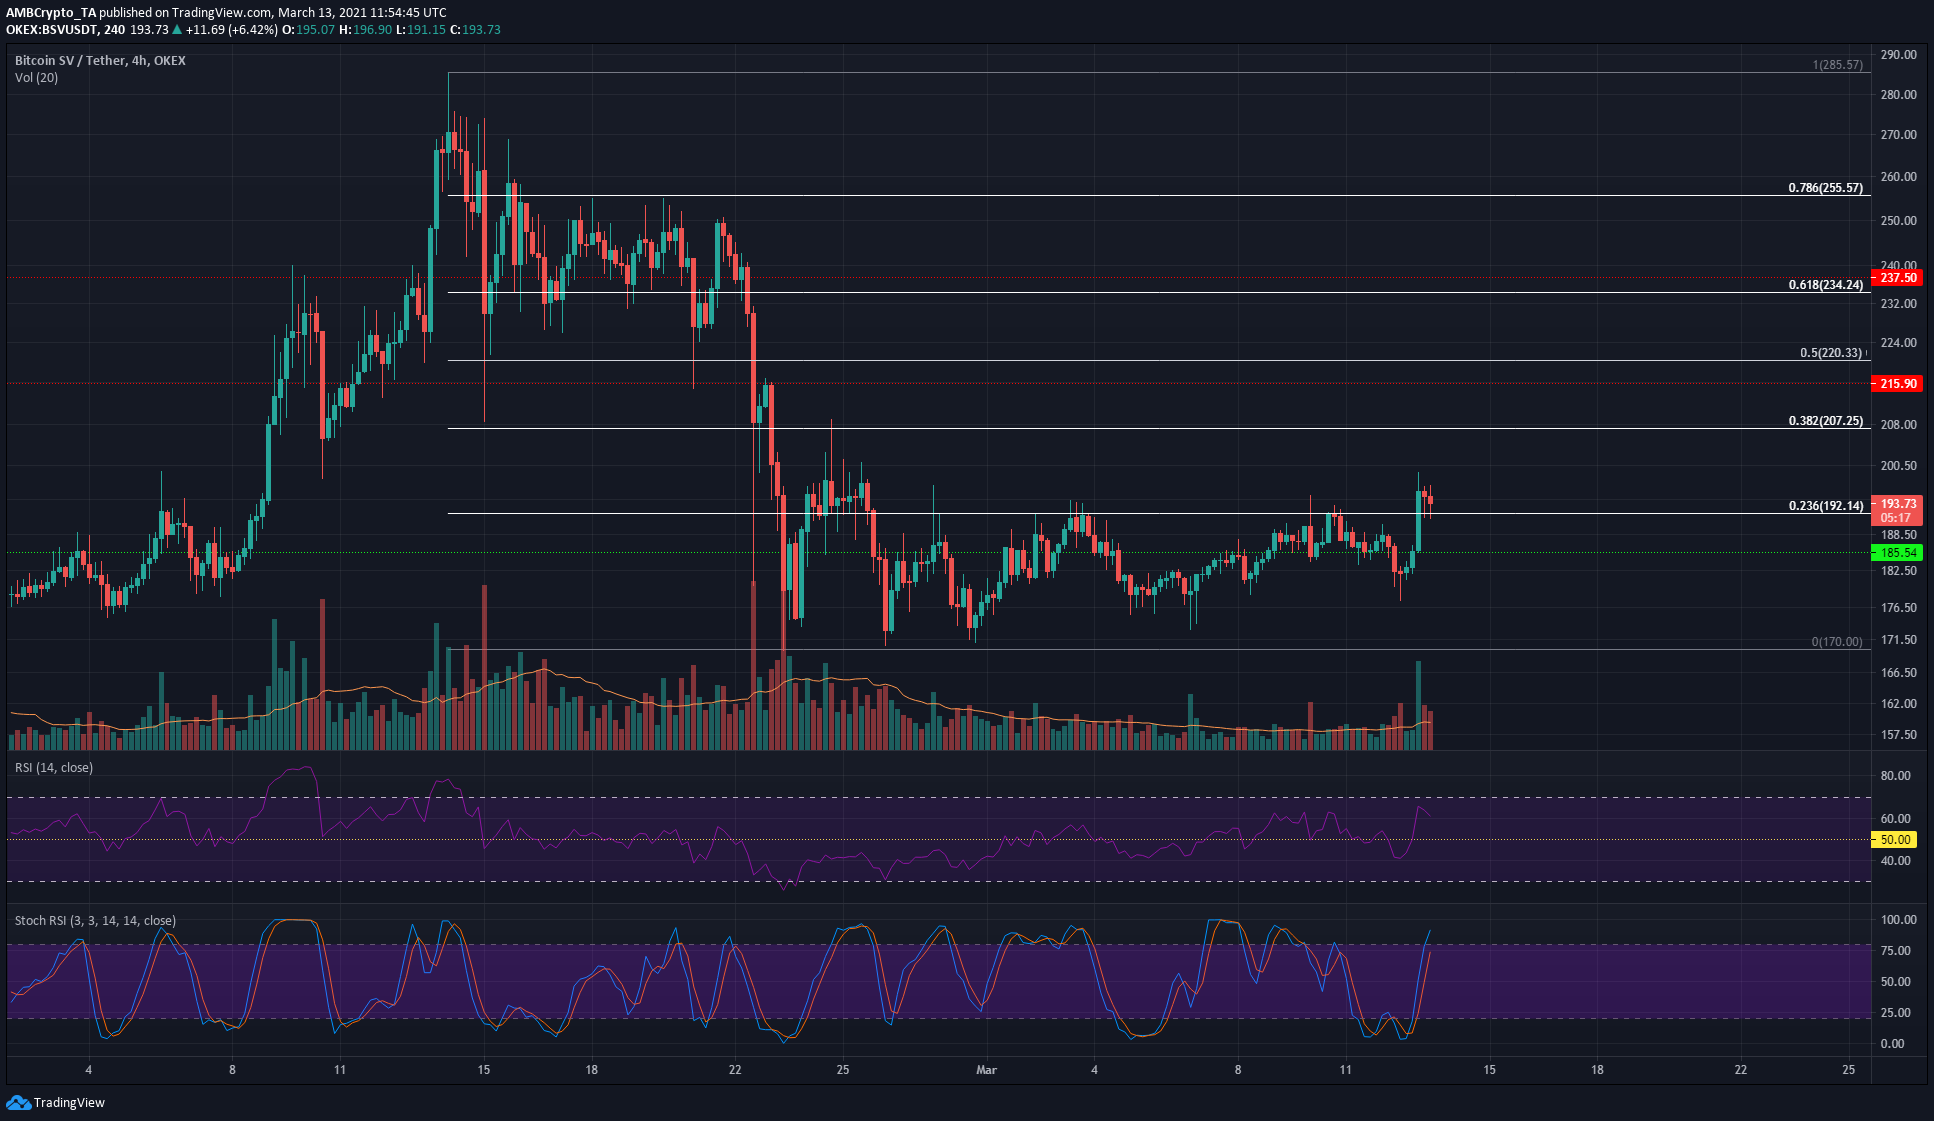
Source: BSV/USDT on TradingView
BSV has been consolidating beneath the $192 mark over the past three weeks. Bitcoin’s move upward is likely to strongly influence BSV as well, and a breakout past $192 could be seen soon.
Based on BSV’s drop from $285 to $170, Fibonacci retracement levels were plotted. BSV climbed above the $192 level and retested it as support in recent hours. The RSI soared past neutral 50 following BSV’s quick move from $182 to $192. The Stochastic RSI was in oversold territory, and BSV could see a minor dip toward $188-$190 before its next leg upward.
Elrond [EGLD]
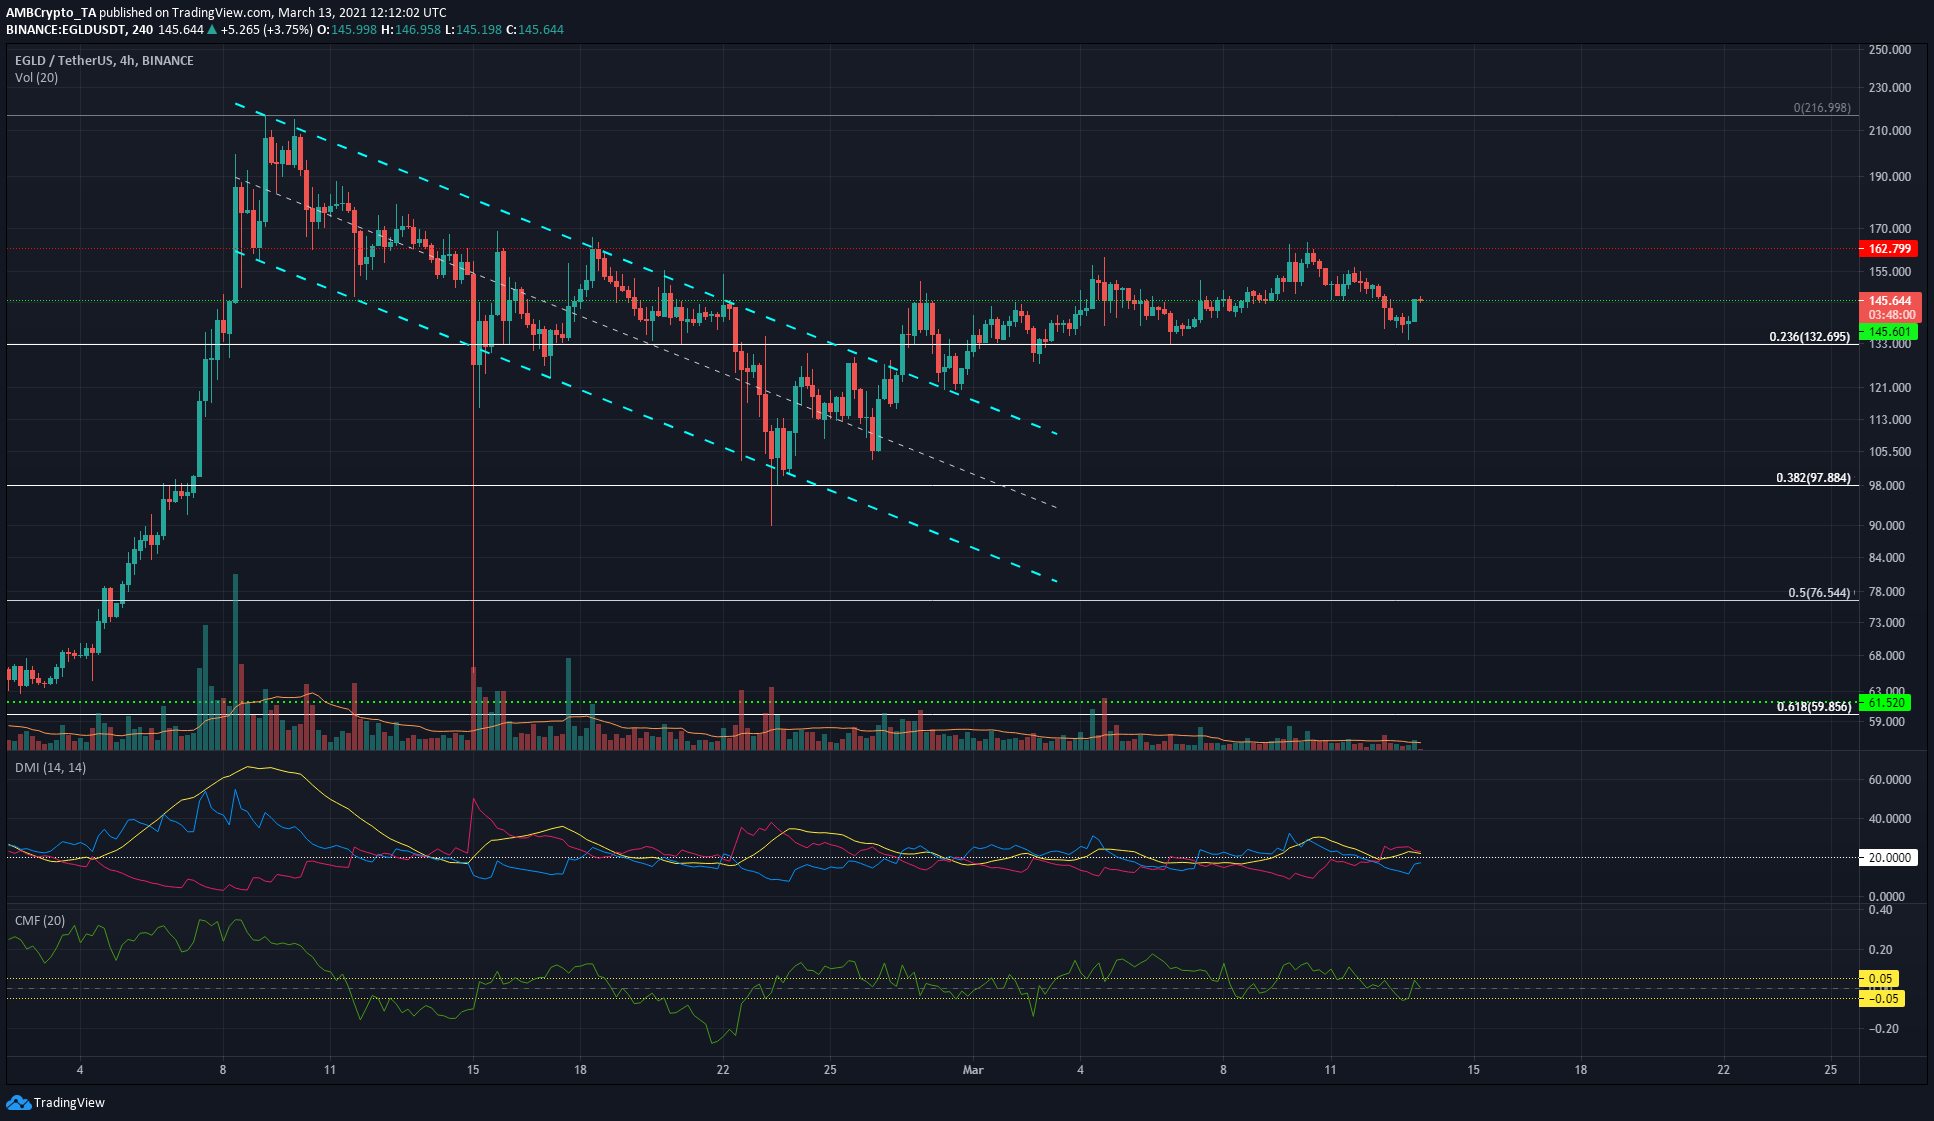
Source: EGLD/USDT on TradingView
EGLD broke out of a descending channel but was unable to climb back toward the channel’s peak at $210, and instead has faced stiff resistance at the $162 mark. The levels to watch out for are $132 as support, $145, and $162 as resistance. At the time of writing, EGLD saw a bounce to $145.
Until these two levels are broken, $162 can be used to enter a short position and $132 to enter a long position. As the Chaikin Money Flow shows, capital flow into and out of the EGLD market has been in equilibrium for the most part of the past week, with the bulls in a more favorable position.
The Directional Movement Index showed that a bearish trend was gathering strength. For EGLD, the $132 and $162 price levels are the ones to watch out for.