
Tron saw the tides shift in favor of the bulls as it rose above a level of resistance and sought to flip it to support. VeChain continued to post gains but the beginnings of a bearish divergence between price and momentum were witnessed. Cosmos formed a V-top pattern and recent bearish pressure could cause the price to sink lower.
Tron [TRX]
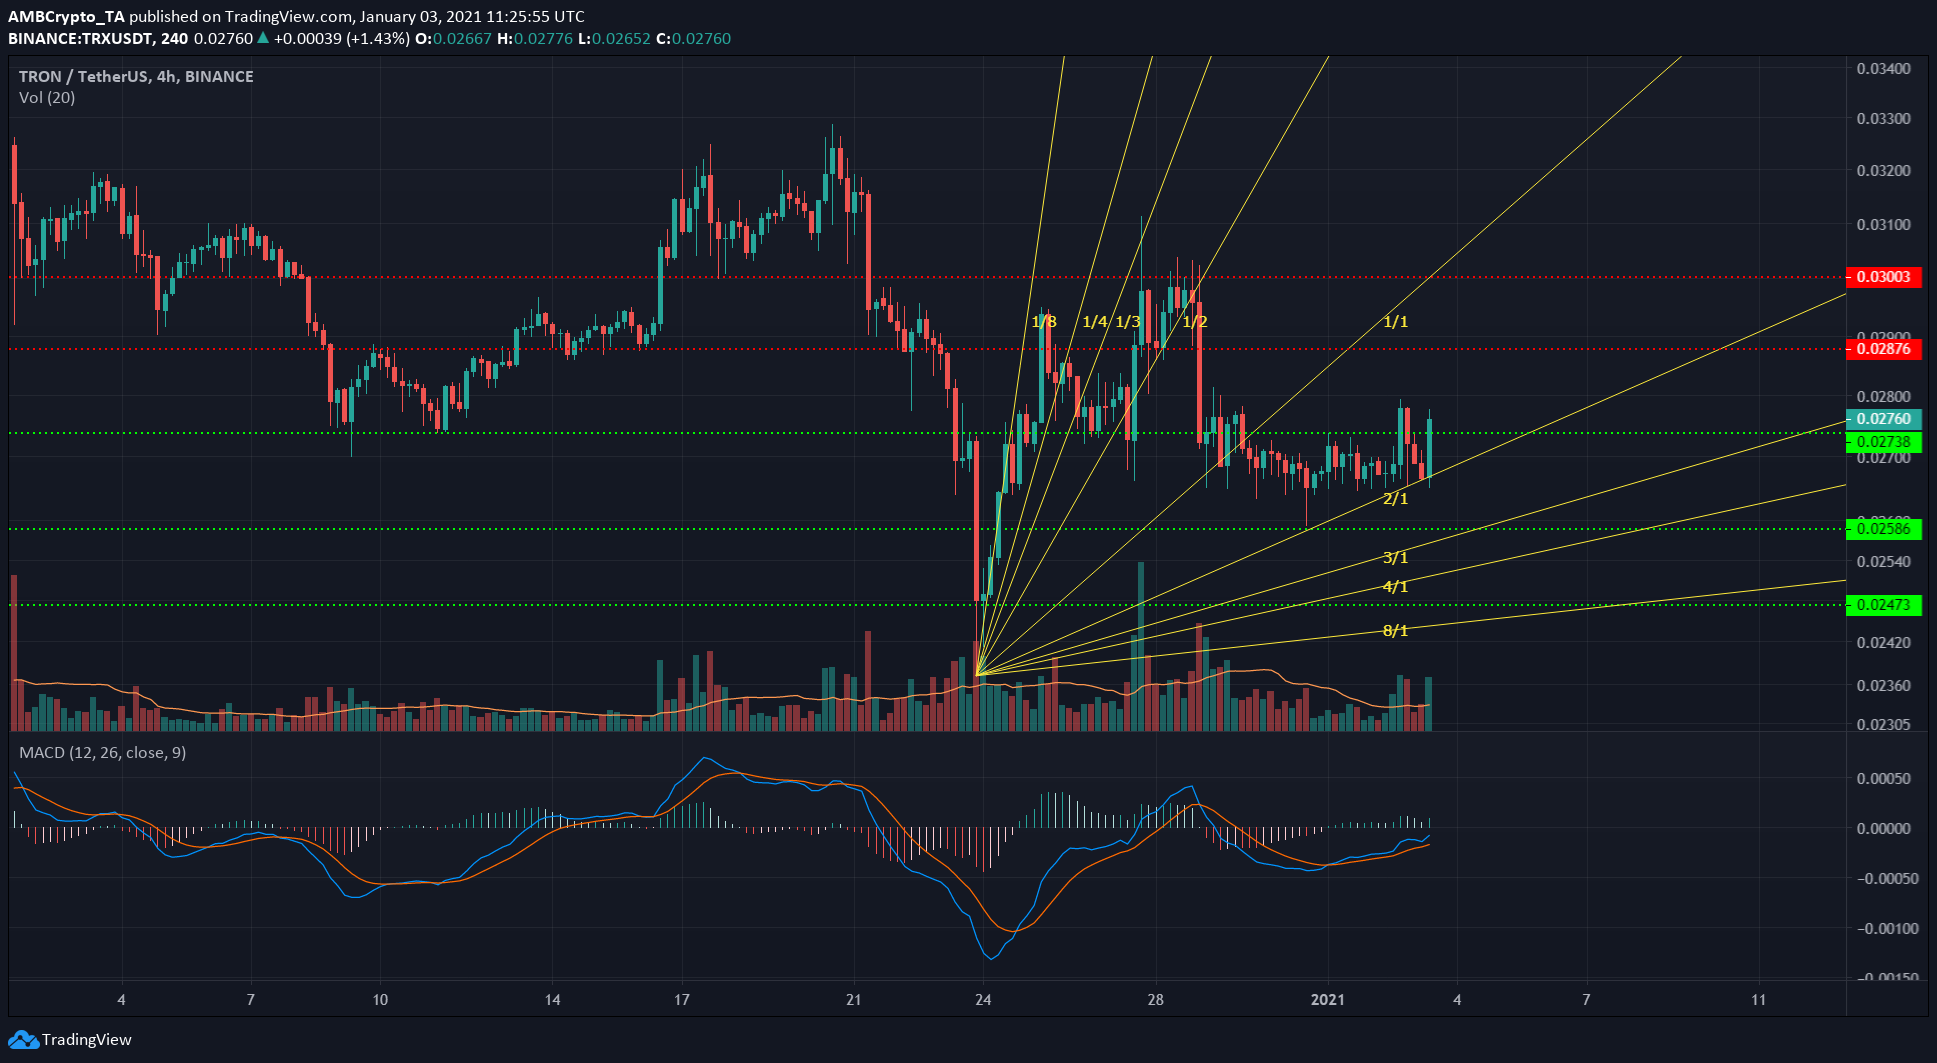
Source: TRX/USDT on TradingView
The 2/1 fan line saw TRX register a sharp upward movement, a trading session that was not yet concluded at the time of writing. The horizontal $0.027 level was a level that bulls would seek to flip to support in the coming hours.
The MACD showed that momentum behind TRX was slowly shifting toward the bulls, as it formed a bullish crossover and rose toward the zero line.
Trading volume has not been insignificant over the past 24 hours, and TRX could see further upside in the coming days upon flipping the resistance level to support.
VeChain [VET]
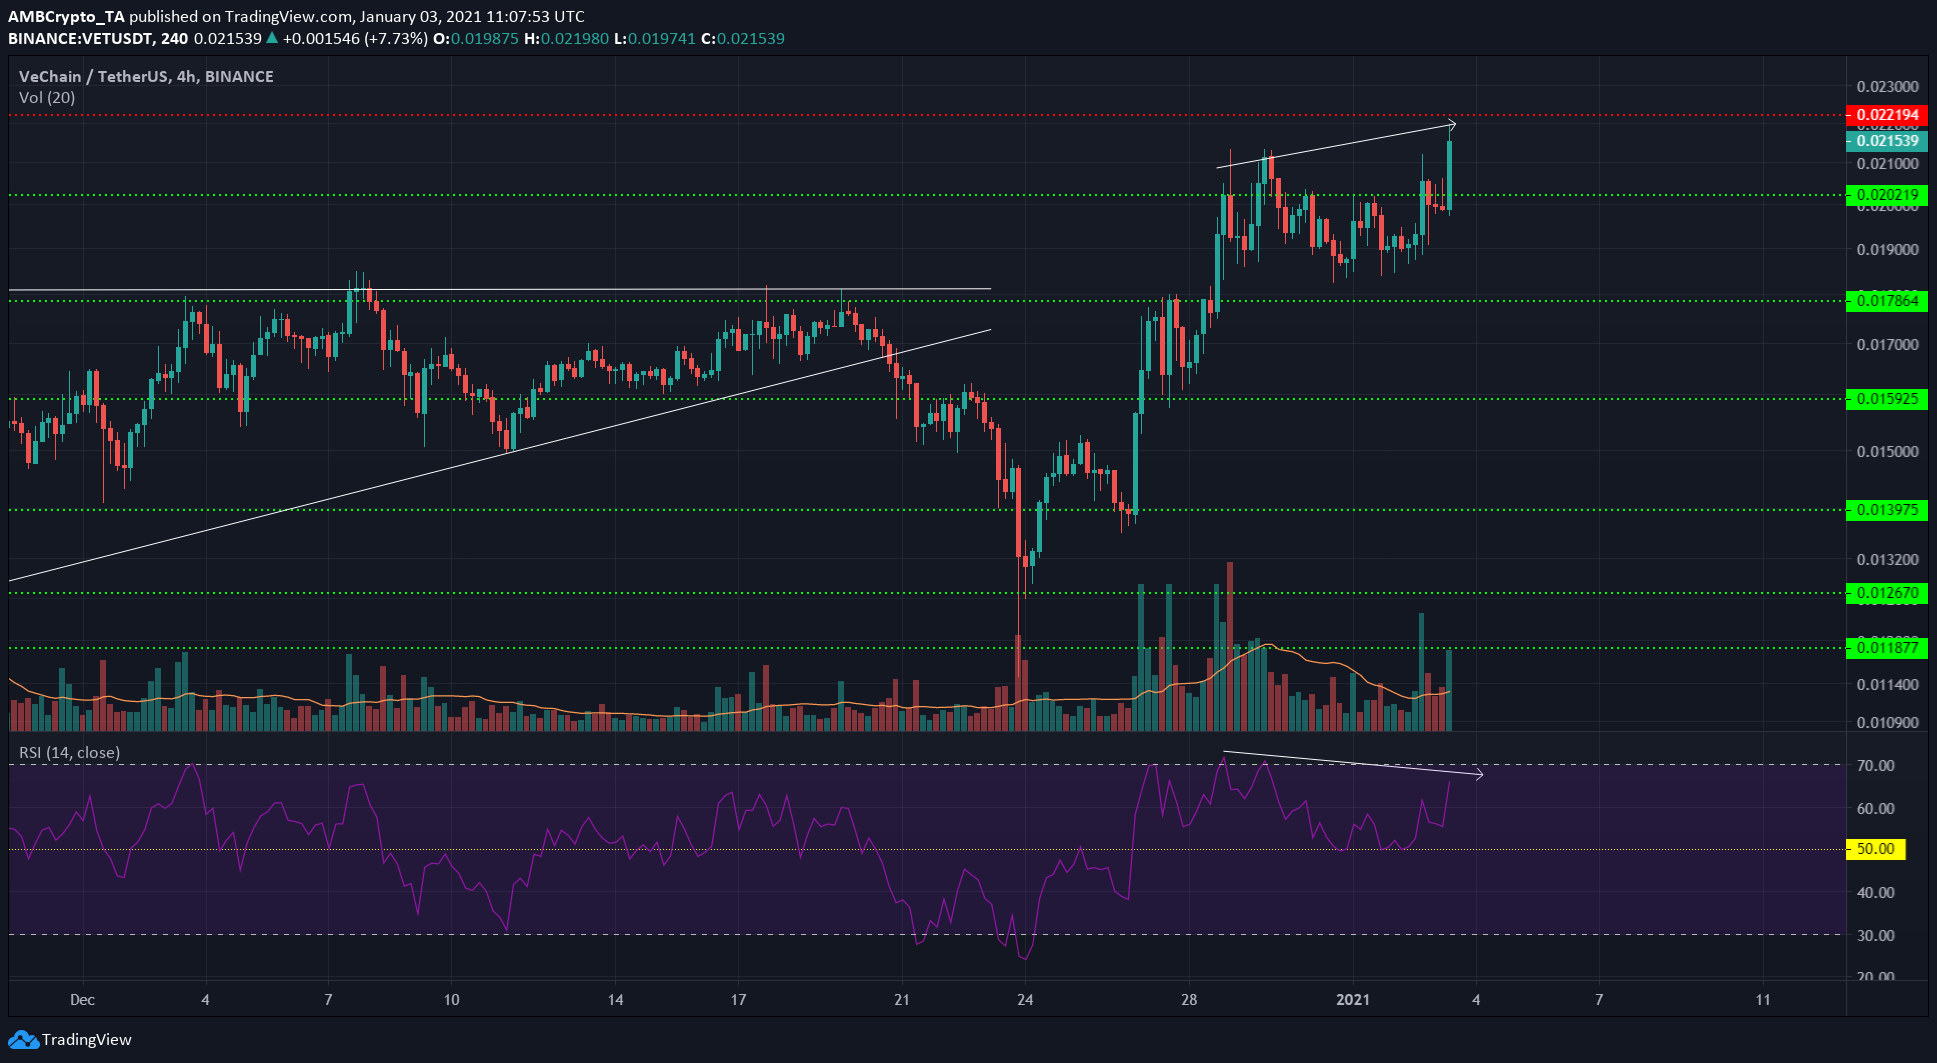
Source: VET/UDST on TradingView
VeChain saw massive gains over the past couple of weeks. The move above $0.018 was a clean breakout above what had previously been a stubborn level of resistance since late November. Flipping the psychological $0.02 to support was also a bullish sign.
The price made higher highs while the RSI appeared to make lower highs. This suggested that VET could witness a pullback. A test of the level of resistance at $0.022 can be followed by a rejection.
This VET correction would be an opportunity to buy unless the next week sees VET descend once more beneath the $0.018 level.
Cosmos [ATOM]
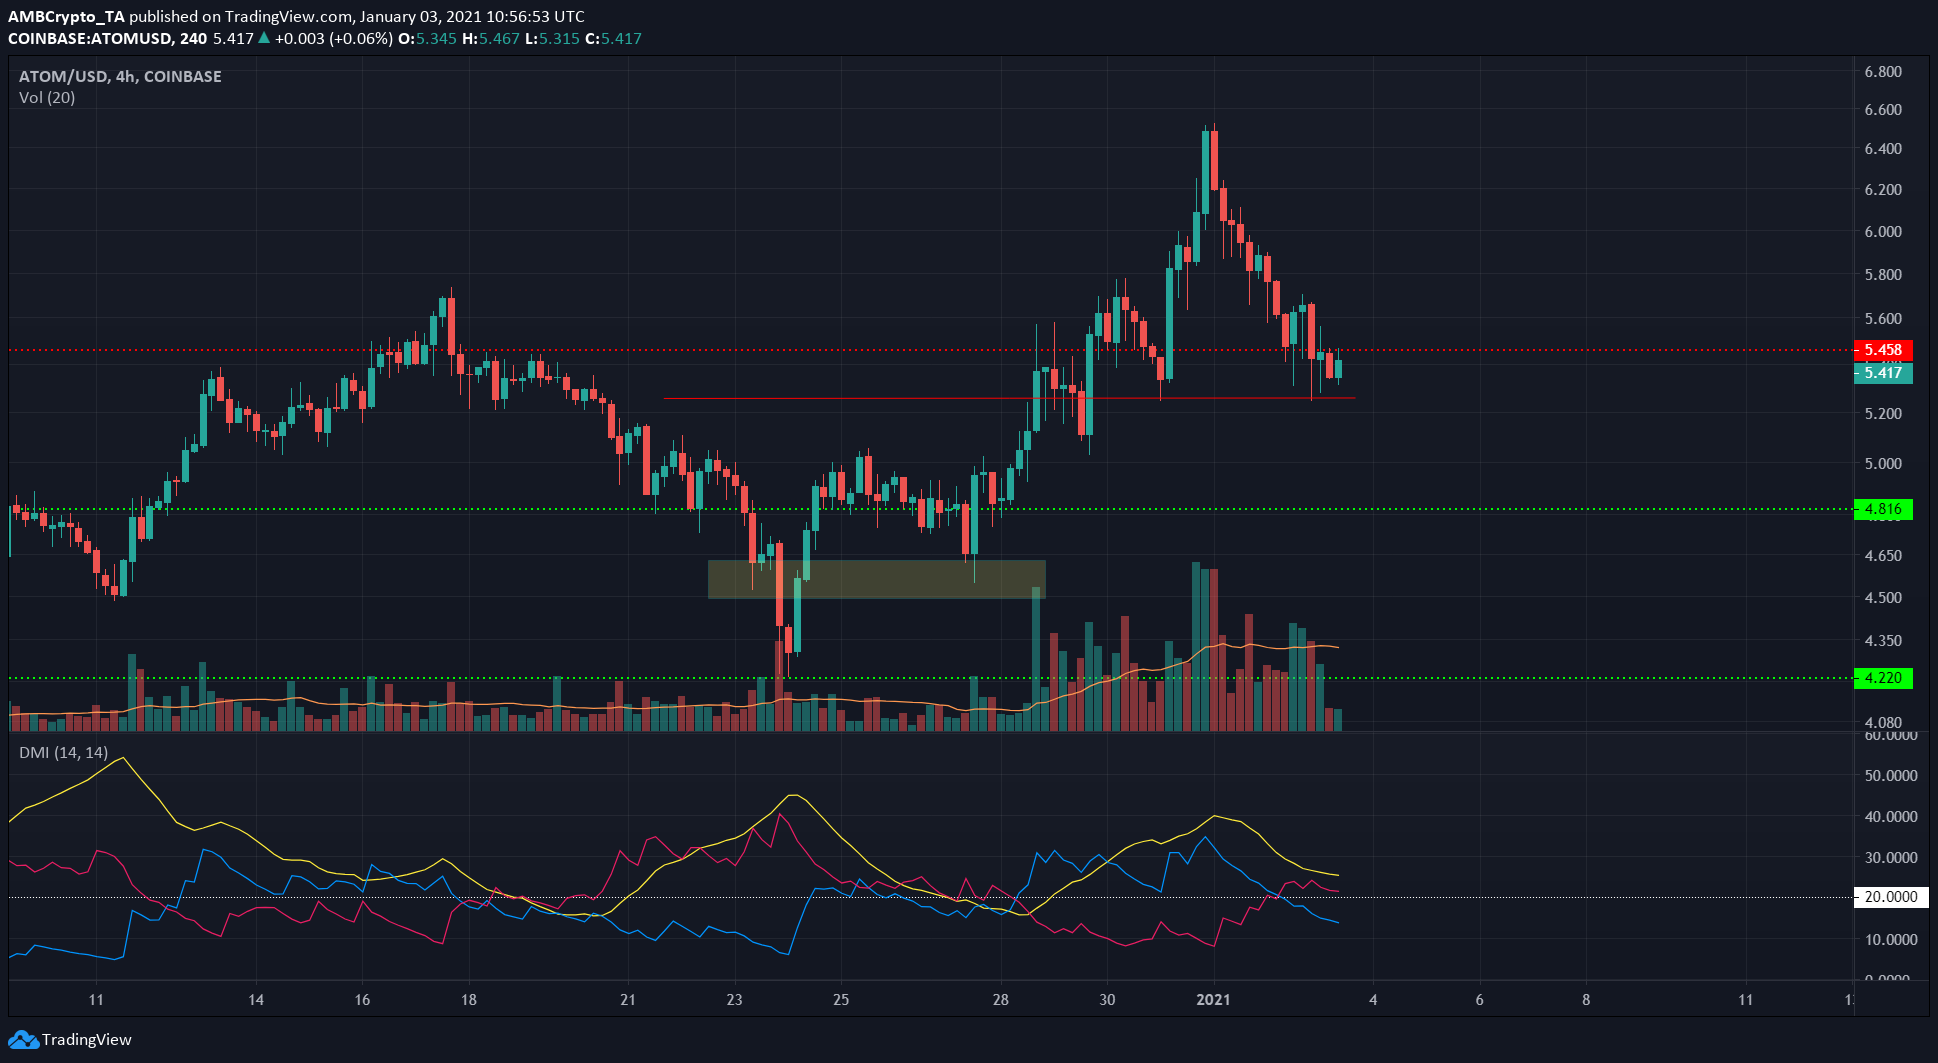
Source: ATOM/USD on TradingView
ATOM formed a V-top pattern. The bullish development of ATOM reclaiming the $6 level was quickly reversed by selling pressure that brought the price back to the $5.45 level.
Beneath it, the $5.25, $5 and $4.8 can be expected to halt or at least slow down further losses for ATOM. However, the Directional Movement Index showed that the strong uptrend had reversed into a strong downtrend, with the ADX (yellow) above 20 while the -DMI (pink) climbed to signify the bearish nature of the trend.
The trading volume has also been significant over the past few days, which suggested that the market acted with conviction and neither move disagreed with market participant sentiment.