Altcoin

Tron prices might decline further as the short-term chart looks bearish with sellers having an upper hand
Posted:

Tron the 14th largest cryptocurrency by market cap has been struggling to gain the lost grounds of 24th September when its price fell from $0.0143 to $0.0115. It was trading at $0.0136 at press time, having seen a decline of 0.80% on the 24-hour price chart.
1-Hour Price Chart
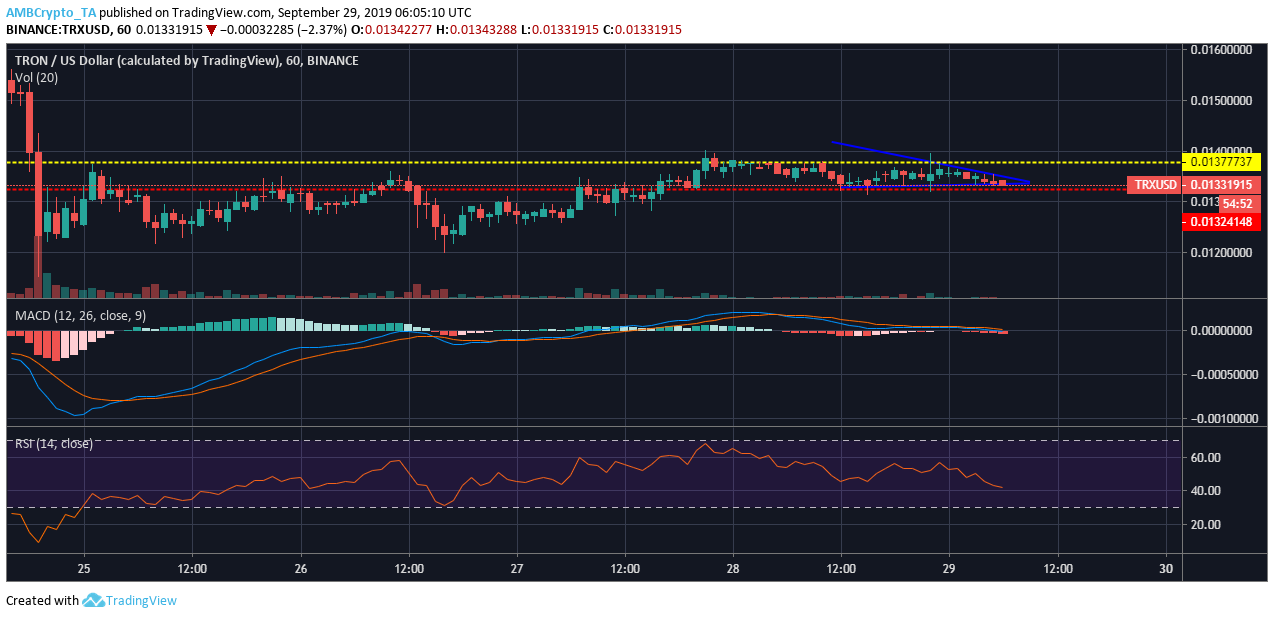
Source: TradingView
The 1-hour price chart of TRX looked bearish in the short term, as it formed a descending triangle characterized by lower highs at $0.0136, $0.0135 and $0.0134. and a constant low of $0.0132. The formation of a descending triangle was followed by a bearish price breakout, which suggested the altcoin might slump further.
RSI indicator showed that the sellers had an upper hand on 28th September, as the indicator moved below median line of 50. Buyers tried their best to bring the bullish sentiment to the market on 27th September which continued on 28th September as well, but sellers had an upper hand starting on 29th September.
MACD line had a bearish cross over on 28th September which it tried to break out of on 29th September, however, bearish momentum prevailed and the momentum looked bullish in the short term.
4-Hour Price Chart
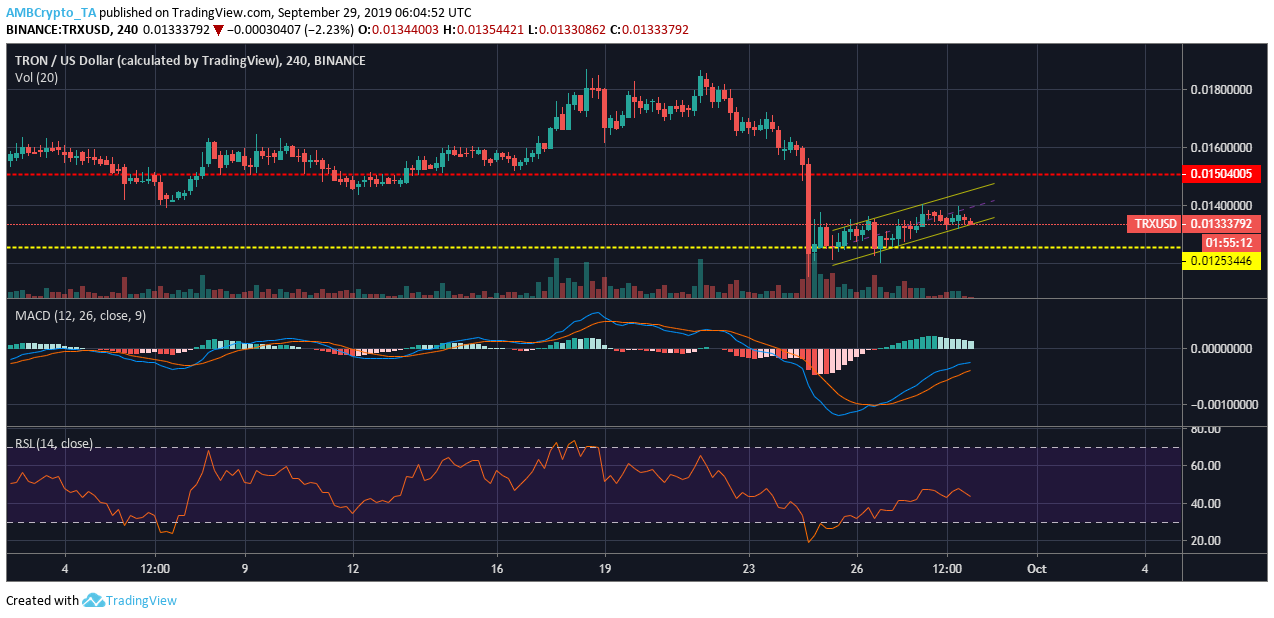
Source: TradingView
In the 4-hour price chart, Tron formed an ascending channel characterized by two ascending parallel lines which formed higher highs at $0.0132, $0.0135, and $0.0140, while the higher lows formed at $0.0125, $0.0126, and $0.0131. An ascending channel was followed by a bearish breakout, which suggested that the value of altcoin might decline further.
Looking at the RSI indicator, Tron was oversold on 24th September and since then selling pressure has been dominant, which suggested bearish sentiment was dominant.
MACD line had a bullish crossover on 26th September and has been above the signal line, but a bearish cross over might be on the cards.
Conclusion
Tron was forming a descending triangle on the 1-hour price chart with a possibility of bearish price break out, while it formed ascending channel on the 4-hour price chart, which indicated another bearish price breakout. The RSI indicator in both cases showed that sellers had an upper hand, thus the short term momentum looked bearish for Tron.


![Why Chainlink [LINK] and Polygon [MATIC] are more similar than you realise](https://ambcrypto.com/wp-content/uploads/2024/04/Chainlink_and_Polygon-1-400x240.webp)

