
Polkadot was consolidating beneath the $42 level. Aave was making some slow gains since the defense of $345, and Dash was in a strong uptrend and attempted to climb past the $300 psychological level.
Polkadot [DOT]
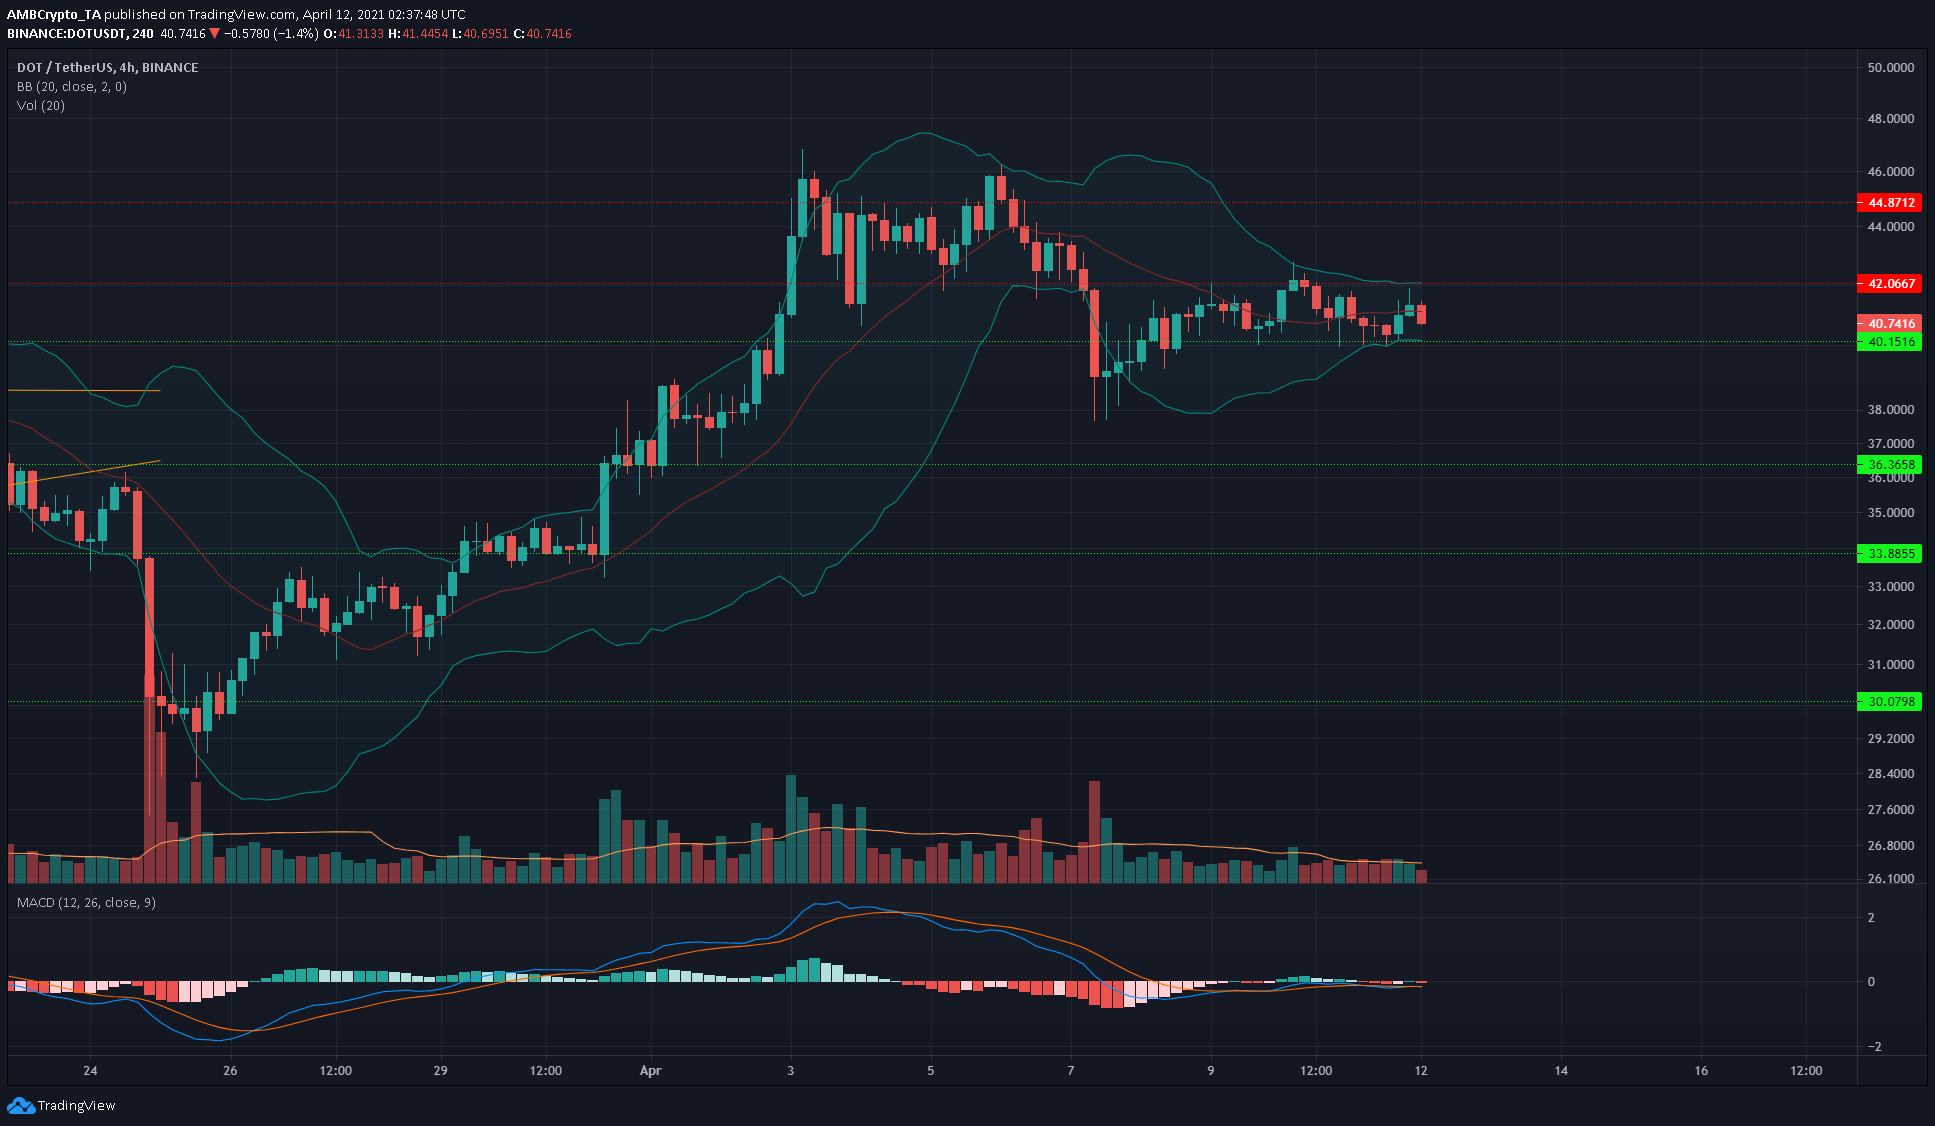
Source: DOT/USDT on TradingView
Polkadot has been consolidating between the $40 and $42 levels over the past few days. This is almost certainly in preparation for another move higher. The trading volume was trending lower, and the MACD showed near-neutral momentum even on the 4-hour chart.
The Bollinger bands remained tight around the price, to confirm the lowered volatility.
Aave [AAVE]
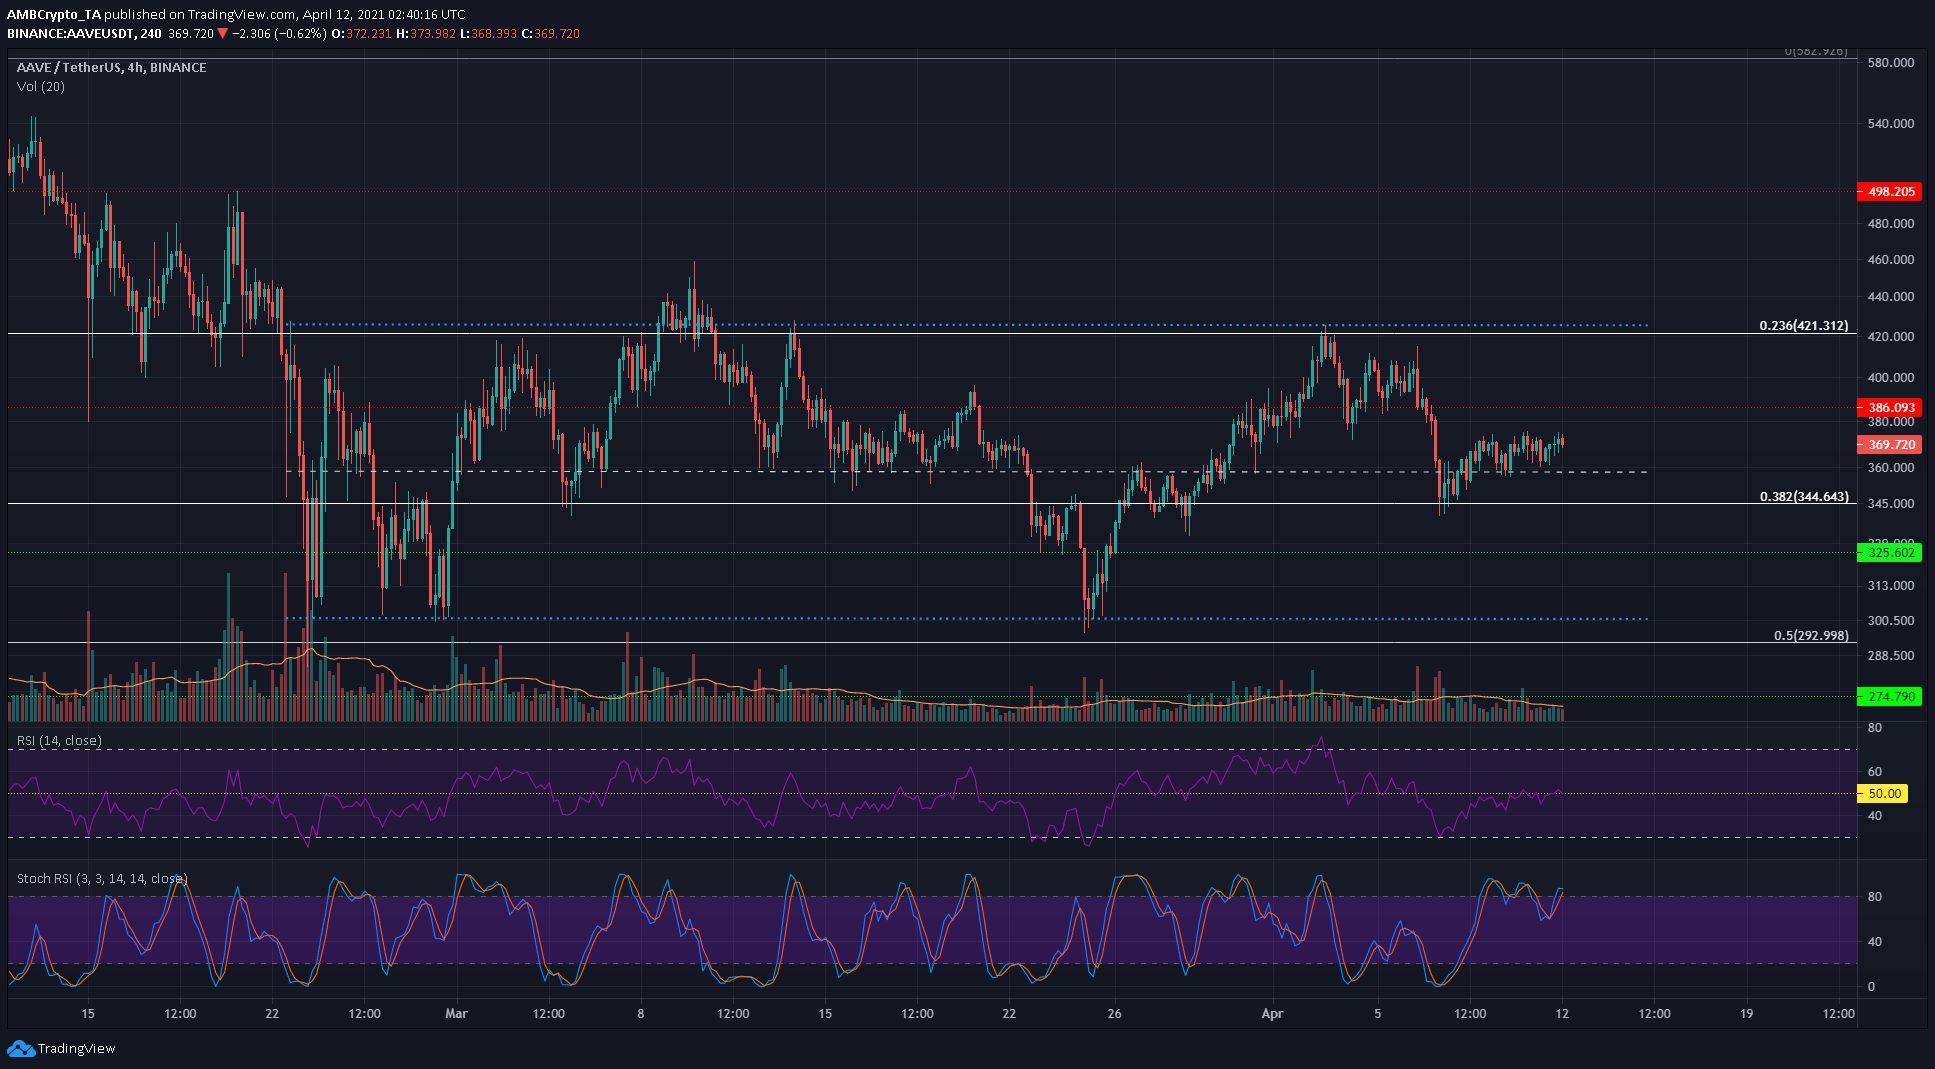
Source: AAVE/USDT on TradingView
Aave had formed a range between $300 and $421 over the past few weeks. The price continued to cling to the mid-point of the range at $360. At the time of writing, AAVE was trading at $367 and faces resistance at the $386 mark.
The RSI was climbing toward neutral 50 in the past few days but has been unable to move above this line. Momentum does not favor buyers or sellers, although the defense of the $345-$360 area last week was a bullish development for that could see AAVE reach the $421 price level again. The Stochastic RSI was in overbought territory, and a dip to $360-$355 can be seen.
Dash [DASH]
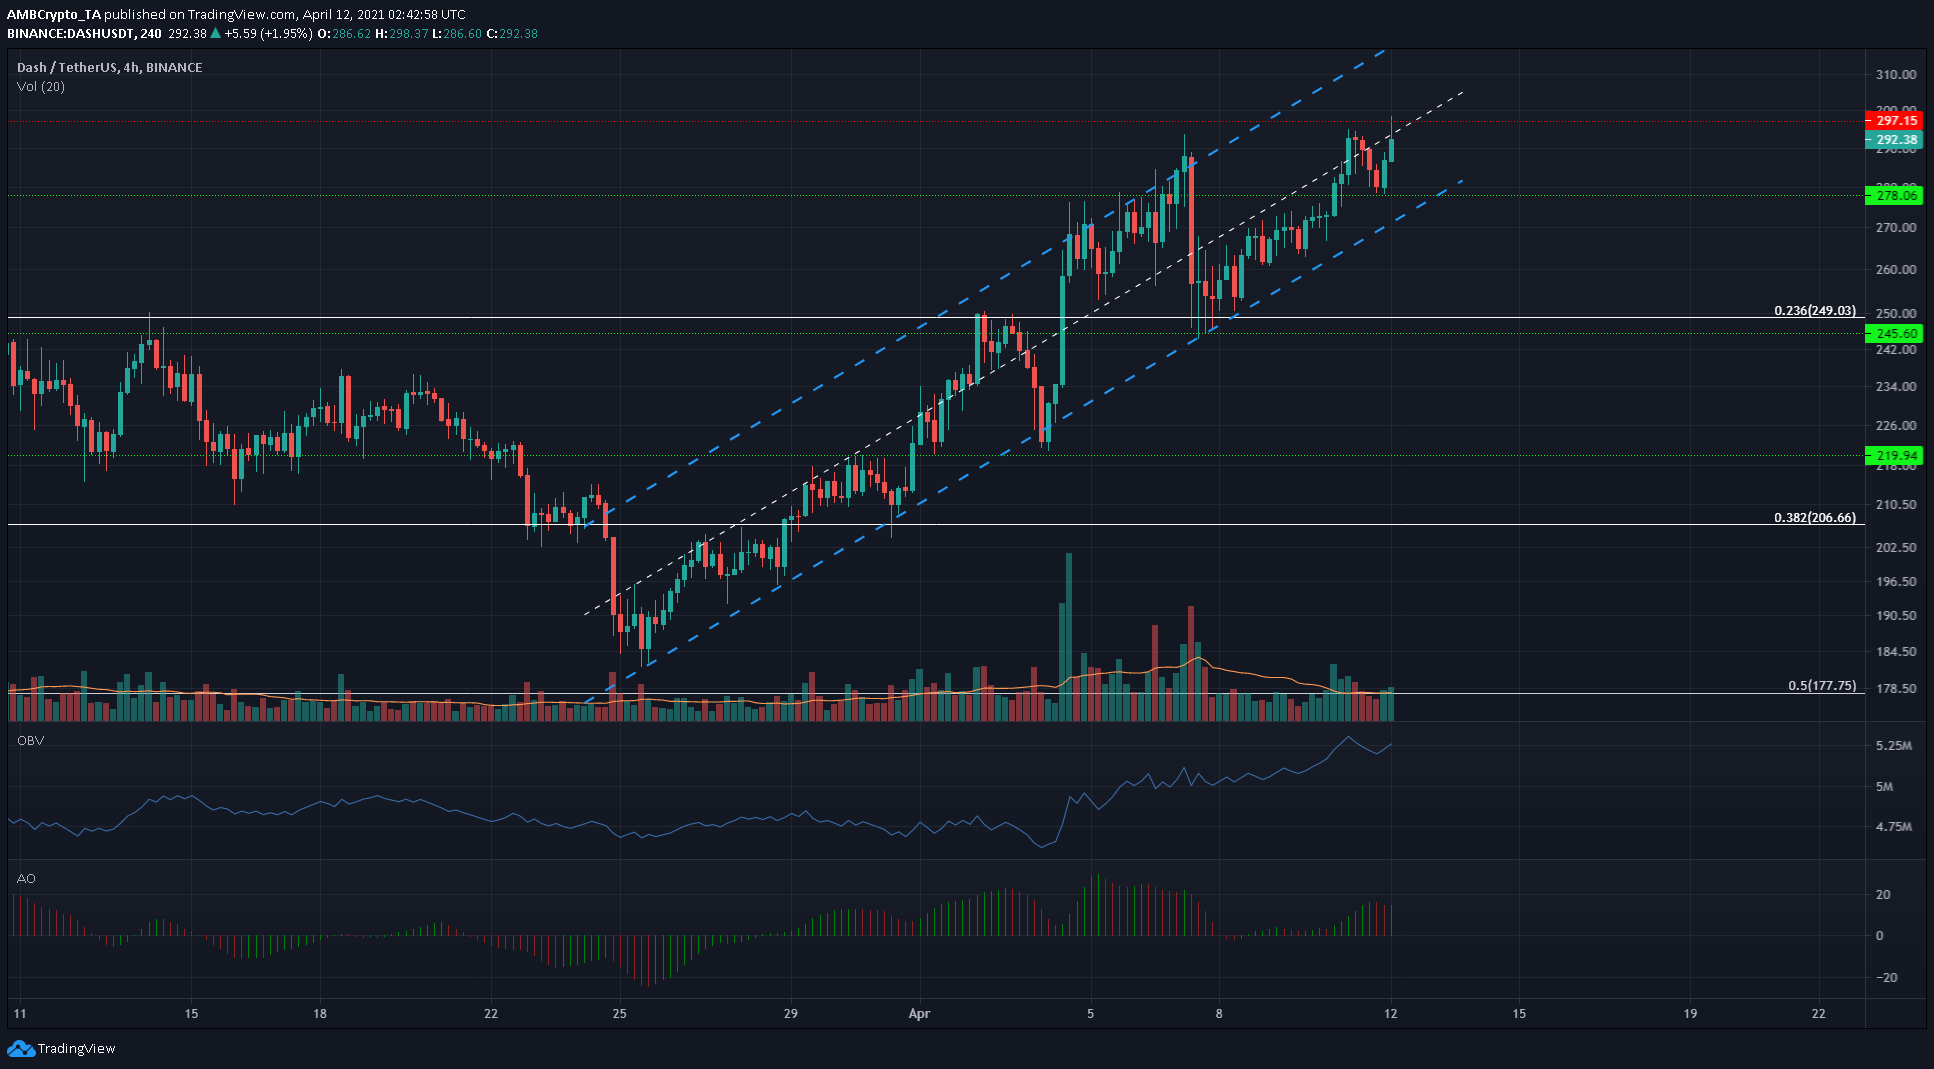
Source: DASH/USDT on TradingView
DASH was trading within an ascending channel. It has seen significant demand from buyers, especially in the past ten days, since it converted the $219 level to support.
The OBV continued to trend upward. The Awesome Oscillator was above the zero line and showed bullish momentum. Dash faced resistance at $297-$300 and had strong support at $278 from the confluence of both horizontal as well as the channel’s lower boundary.
The ascending channel is a bearish reversal pattern – a trading session close beneath the channel will see an asset retrace some/all of the gains made. In this case, however, $250 should halt any retracement. It was a strong resistance for all of March, and only recently flipped to support and should hold on a retest.


![Why Chainlink [LINK] and Polygon [MATIC] are more similar than you realise](https://ambcrypto.com/wp-content/uploads/2024/04/Chainlink_and_Polygon-1-400x240.webp)

