Litecoin retook the $195 level but might need to overcome some retaliation by the bears to target a northbound move towards resistance at $218. Ontology was close to overturning bearish sentiment in the market as 50-SMA eyed a rise above 200-SMA. Lastly, VeChain’s indicators flashed red signals and projected a short-term pullback from record levels.
Litecoin [LTC]
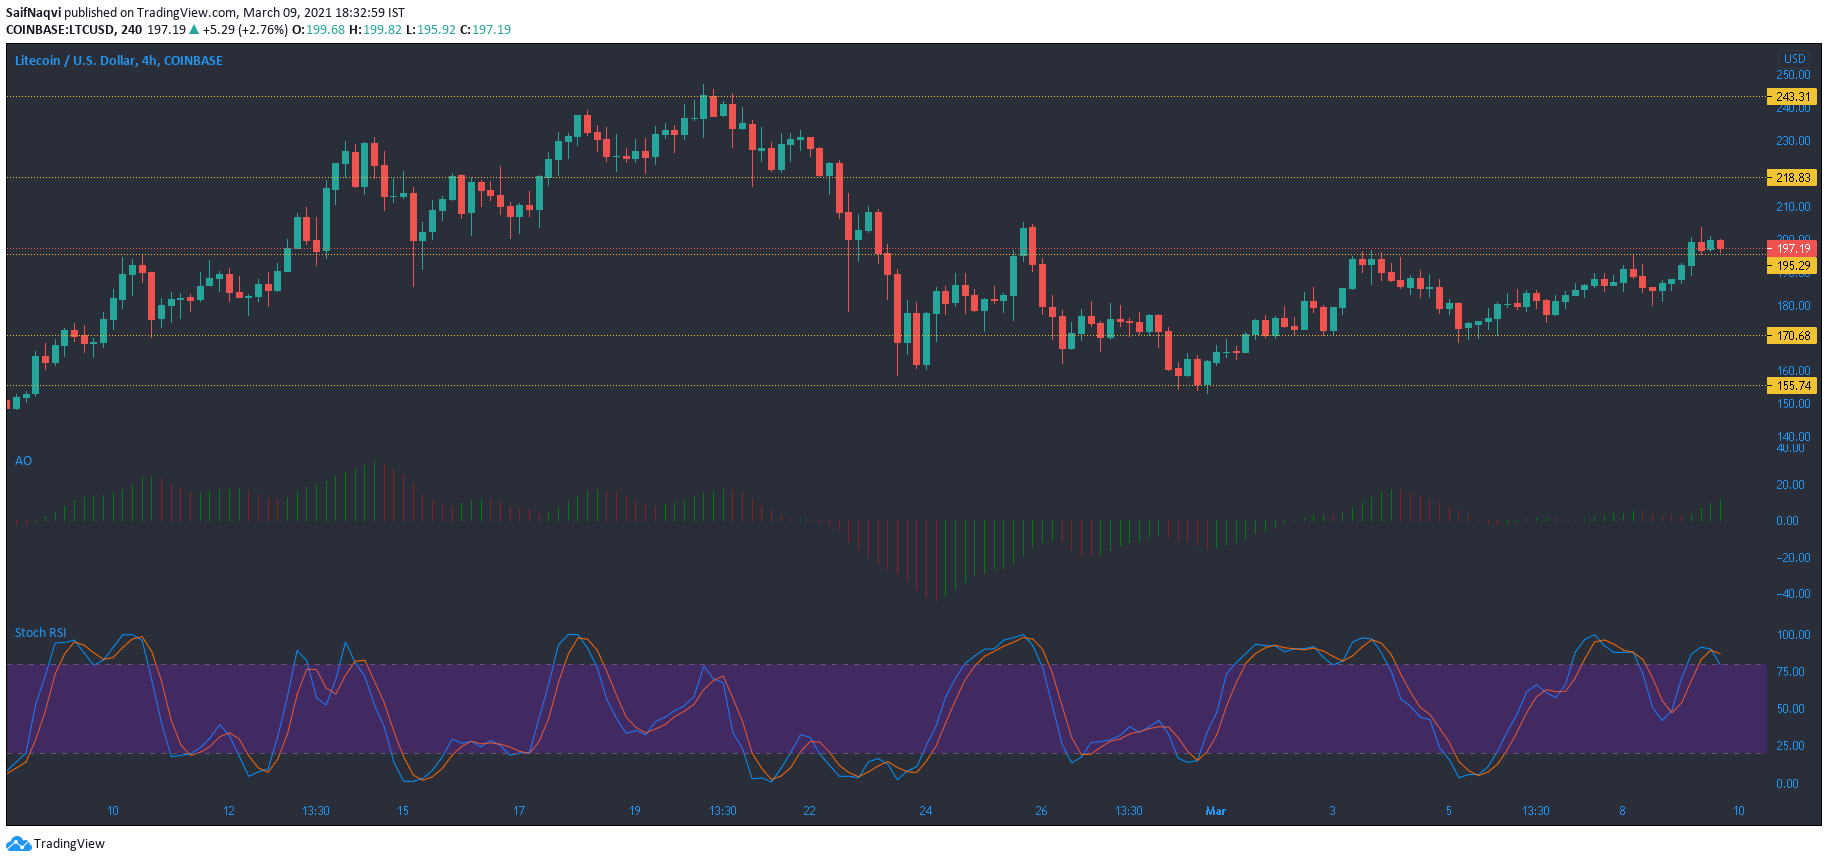
Source: LTC/USD, TradingView
Litecoin flipped $195.29 resistance at the time of writing and broke away from its fixed channel. A fight from the bears was observed on the 4-hour timeframe, as bearish candlesticks were prominent. A rise toward the next resistance at $218 would depend on the bulls’ ability to hold on to the newly turned support mark.
Momentum aided the bulls as Awesome Oscillator’s green bears increased in length. On the other hand, a bearish crossover in Stochastic RSI presented a roadblock for the buying side. A fall below $170.7 support would likely see LTC move toward the next line of defense at $155.7.
Ontology [ONT]
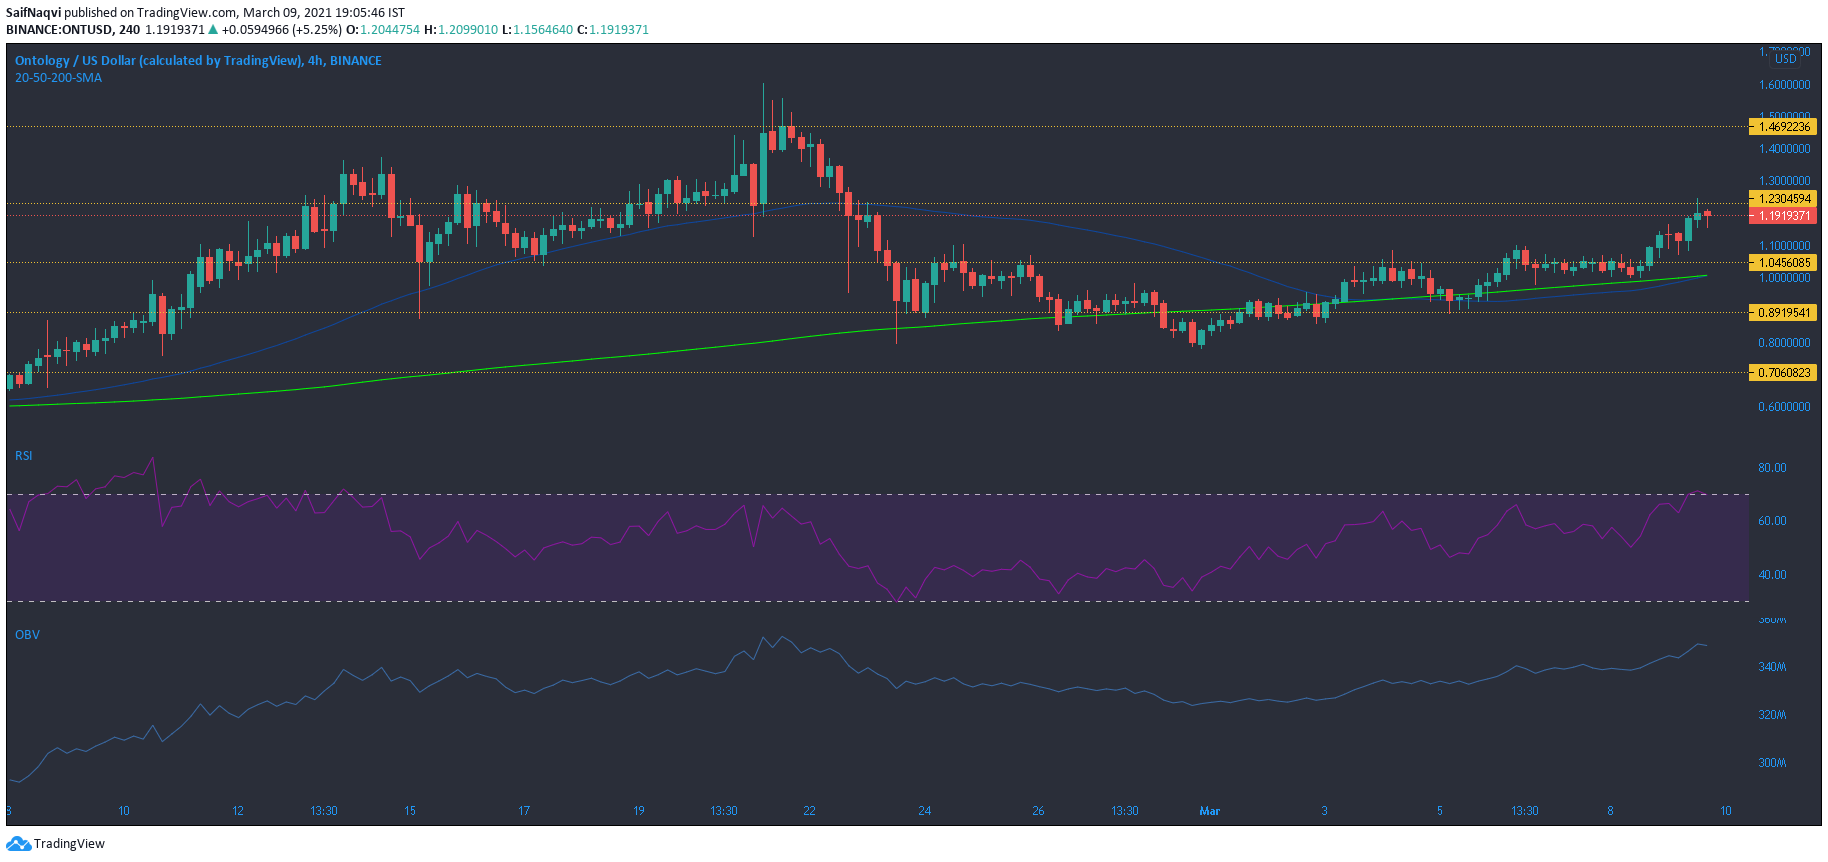
Source: ONT/USD, TradingView
Ontology seemed to be one of the beneficiaries of a broader market rally, as the price surged by over 16% in the last 24 hours. The 50-SMA (blue) also looked to cross above 200-SMA (green) and added another layer of bullish sentiment in the market. A rise above $1.23 resistance could spur additional buying in the market and boost ONT toward the next ceiling at $1.46.
RSI reversed direction after briefly visiting the overbought section and created an obstruction for the bulls. OBV, however, showed healthy buying pressure and backed a favorable outcome moving forward.
VeChain [VET]

Source: VET/USD, TradingView
Weekly gains on VeChain stood strong at over 44% as the cryptocurrency moved within an ascending channel since bouncing back from $0.036 support. At the time of writing, VET traded at a record high of $0.06, but still a fair distance away from the $1 mark. In fact, on chain-metrics showed that the cryptocurrency might need to negotiate a period of selling pressure before continuing its strong uptrend.
RSI fell from the upper region, while MACD closed in on a bearish crossover. A healthy pullback toward $0.058 support was a possibility in the coming sessions. However, bulls might need to remain cautious as a move below the lower trendline could spark an additional sell-off in the market. Such a move would put support levels at $0.052 and $0.047 under the spotlight.