
The collective crypto narrative is bullish at the moment. Ethereum registered a new all-time high above $1600 over the past 24-hours, and Bitcoin surged above $38,000 again. While Chainlink attested a high of $26 as well, it registered a floor price of $22.74 within the next 24-hours.
While present valuation was solid at the moment, Chainlink might face a downward swing as certain on-chain metrics were indicative of a bearish period.
Chainlink Transaction Volume, Median Transfer Value drops
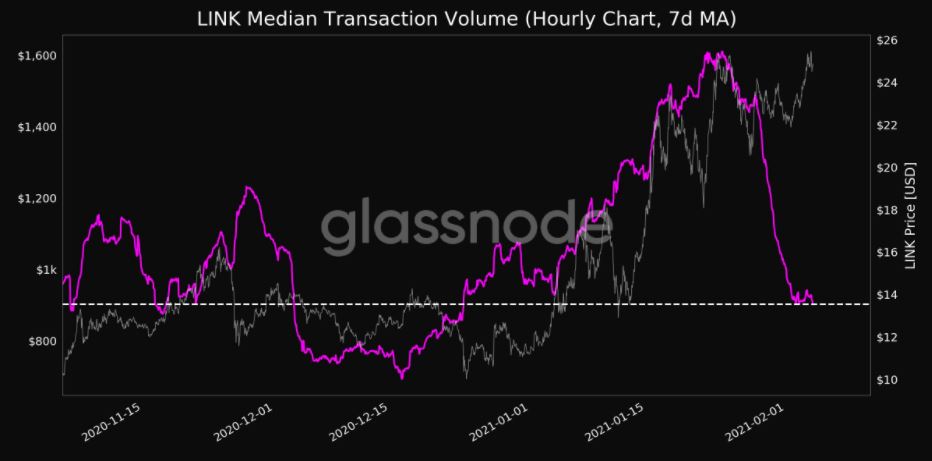
Source: Glassnode
According to glassnode, Chainlink’s Median Transaction Volume registered a 1-month low on its 7-day moving average, indicating a possible decrease in activity. Additionally, it was also identified that transaction volumes, on the whole, were decreasing as well, dropping down to approx 629k LINK from 900k LINK on the 15th of January.
However, these were not the only signs of decline for Chainlink.
According to Santiment, the number of daily active addresses on LINK’s network has dropped drastically in the last seven days. With the drop in addresses, the transaction volume decrease goes hand-in-hand, suggestive that users might be worried about stagnation.
The MVRV indicator might be the tipping point at press time.
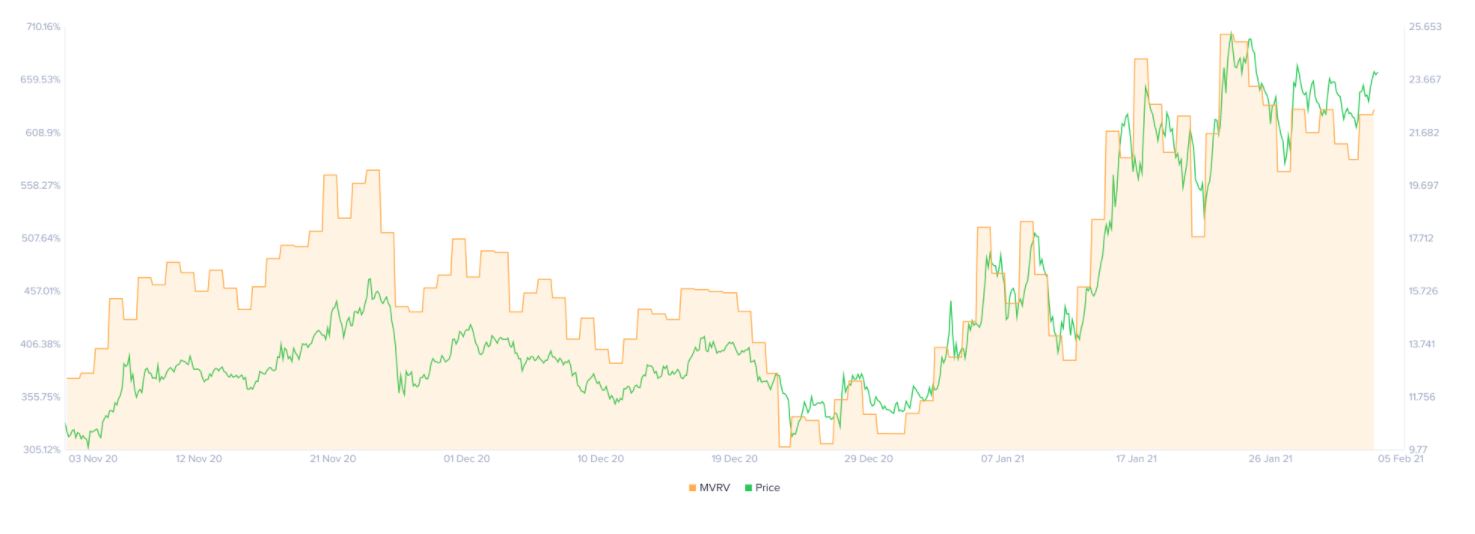
Source: Twitter
The Market-Value to Realised-Value metric indicates the average profit and loss attained by LINK holders depending on the last price movement. Now, at the moment, the MVRV score is pretty high for LINK which meant that holders are more likely to sell at this point. A low MVRV is bullish since it indicates fewer holders are in profit, and a high MVRV could necessarily increase the selling pressure if the prices fail to hold or consolidate higher in the charts.
LINK pattern is still somewhat bullish
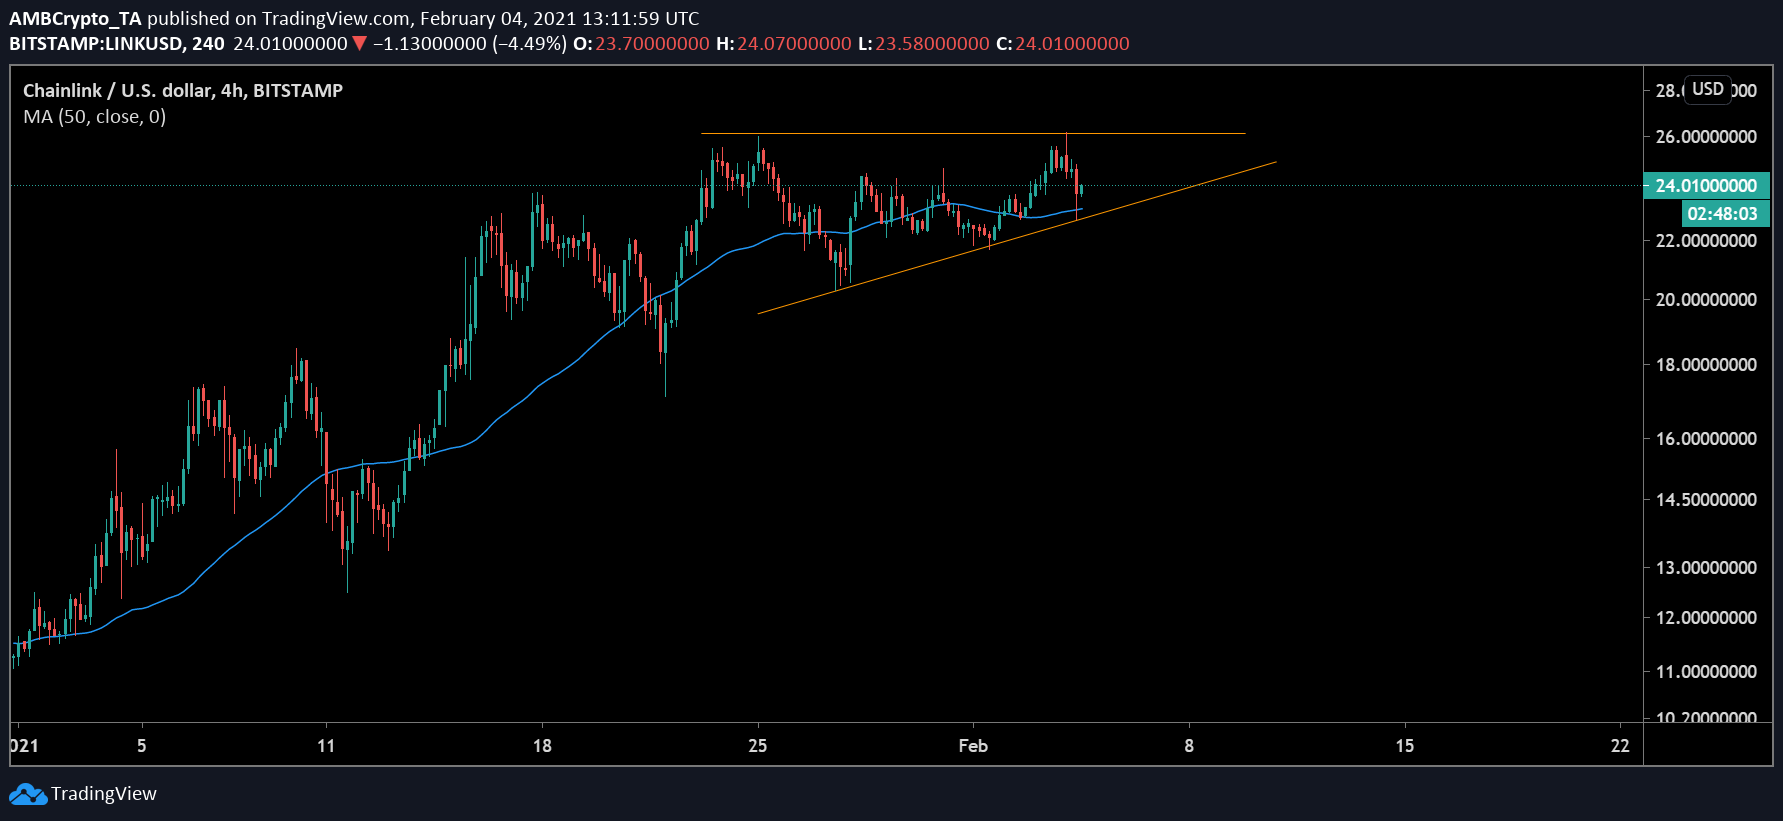
Source: Trading View
From a market structure point of view, LINK is still on the right side of the market. Exhibiting an ascending triangle in the charts, the asset is steering clear above the 50-Moving Average and there are strong higher lows tested within the pattern.
However, market dynamics have opposed patterns in the past, so it is critical to keep an eye on Chainlink’s market as a whole.


![Why Chainlink [LINK] and Polygon [MATIC] are more similar than you realise](https://ambcrypto.com/wp-content/uploads/2024/04/Chainlink_and_Polygon-1-400x240.webp)