
After hitting a yearly high of $0.091, the price of the 12th largest cryptocurrency, Cardano [ADA], has been going downhill. ADA has been trading at around $0.043 for a while now and the short-term chart for ADA revealed that this trend might continue as it indicated a bearish sentiment.
At the time of writing, Cardano was trading at $0.038, with its price recording a fall of 5.26 percent over the last 24-hours.
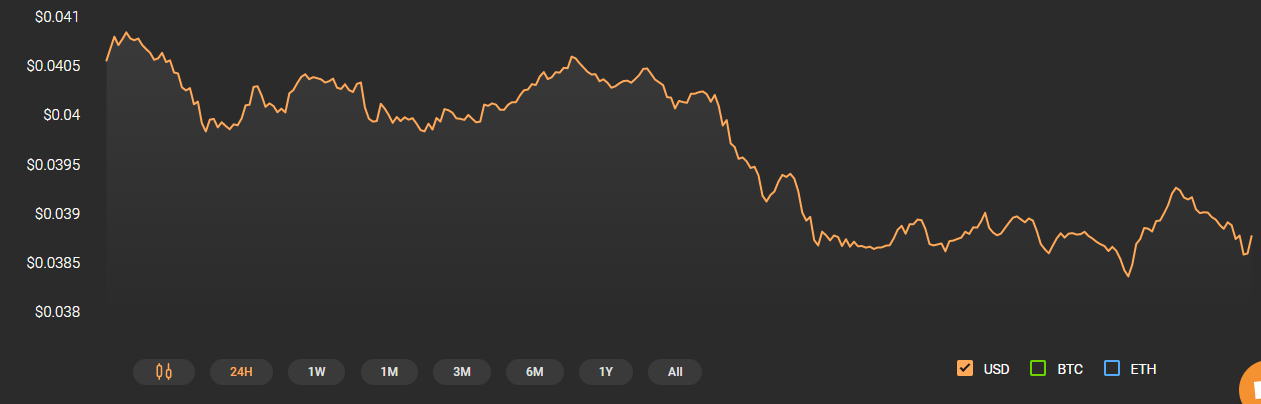
Source: CoinStats
Cardano’s 1-hour chart
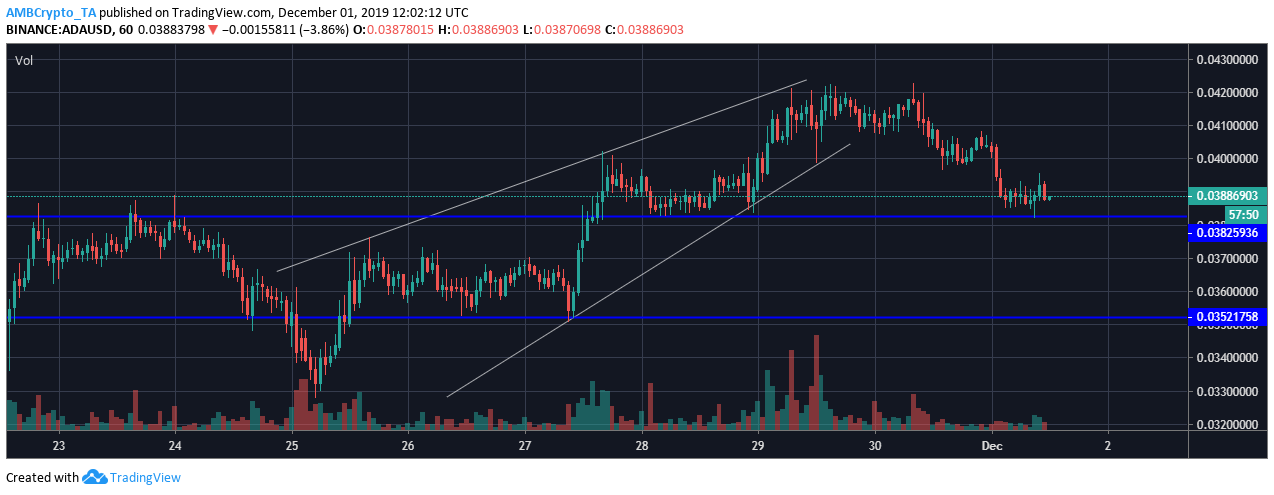
Source: ADA/USD on TradingView
The short-term chart for ADA formed a rising wedge pattern with an upper trend line producing higher highs at $0.037, $0.040 and $0.042. This was followed by a lower trend line with higher lows at $0.035, $0.038 and $0.039. As expected from the formation of the above-mentioned pattern, the direction of the breakout was downwards. As seen in the chart, the price of ADA seemed to have been going upwards with a fairly low volume. Soon after, there was a surge in the volume and the price breached the rising wedge pattern and was seen depreciating, along with the volume.
Additionally, major support lines were seen formed at $0.035 and $0.038. However, the latest breakout might cause ADA to breach the support formed at $0.038.
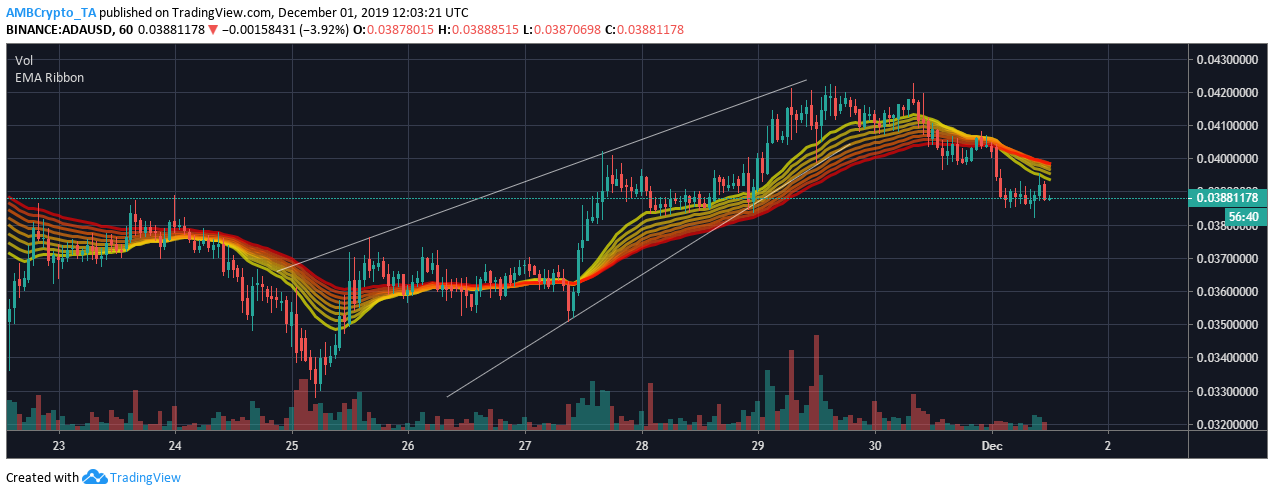
Source: ADA/USD on Trading View
As seen in the above chart, the candlesticks were below the EMA Ribbon throughout the formation of the rising wedge pattern. However, soon after the breakout, the candlesticks were seen below the indicator, further highlighting a bearish market.
Key Indicators
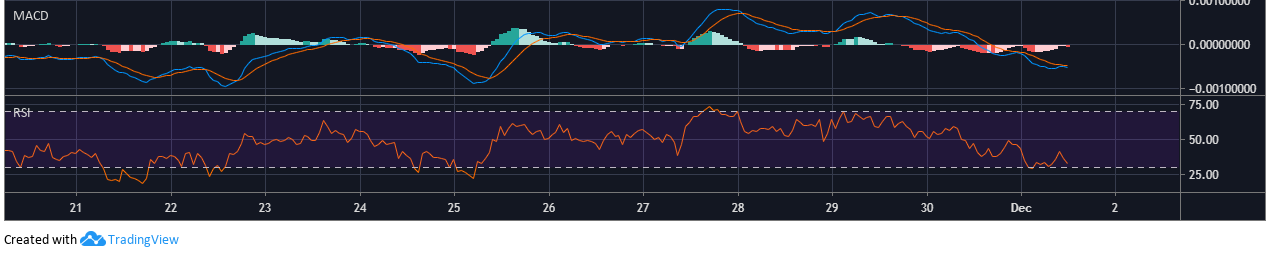
Source: ADA/USD on Trading View
Furthermore, the MACD indicator also affirmed the presence of bears in the ADA market as the MACD line was seen below the signal line. However, both lines seemed to be close to converging. The Relative Strength Index revealed that ADA was in the oversold zone, as the RSI line was below the 50 median, specifically at the 35.22 median.
Conclusion
The short-term chart for ADA revealed strong bearish sentiment and the altcoin might breach its next major support, further pushing the coin’s price to a new yearly low.


![Why Chainlink [LINK] and Polygon [MATIC] are more similar than you realise](https://ambcrypto.com/wp-content/uploads/2024/04/Chainlink_and_Polygon-1-400x240.webp)