The altcoin market shared a few commonalities over the past few weeks. While many registered a strong uptrend on the charts, the same was followed by a pullback in recent days. Bitcoin SV was one such altcoin, while Neo also bounced off its level of retracement. Finally, VeChain was trading within a range.
Bitcoin SV [BSV]
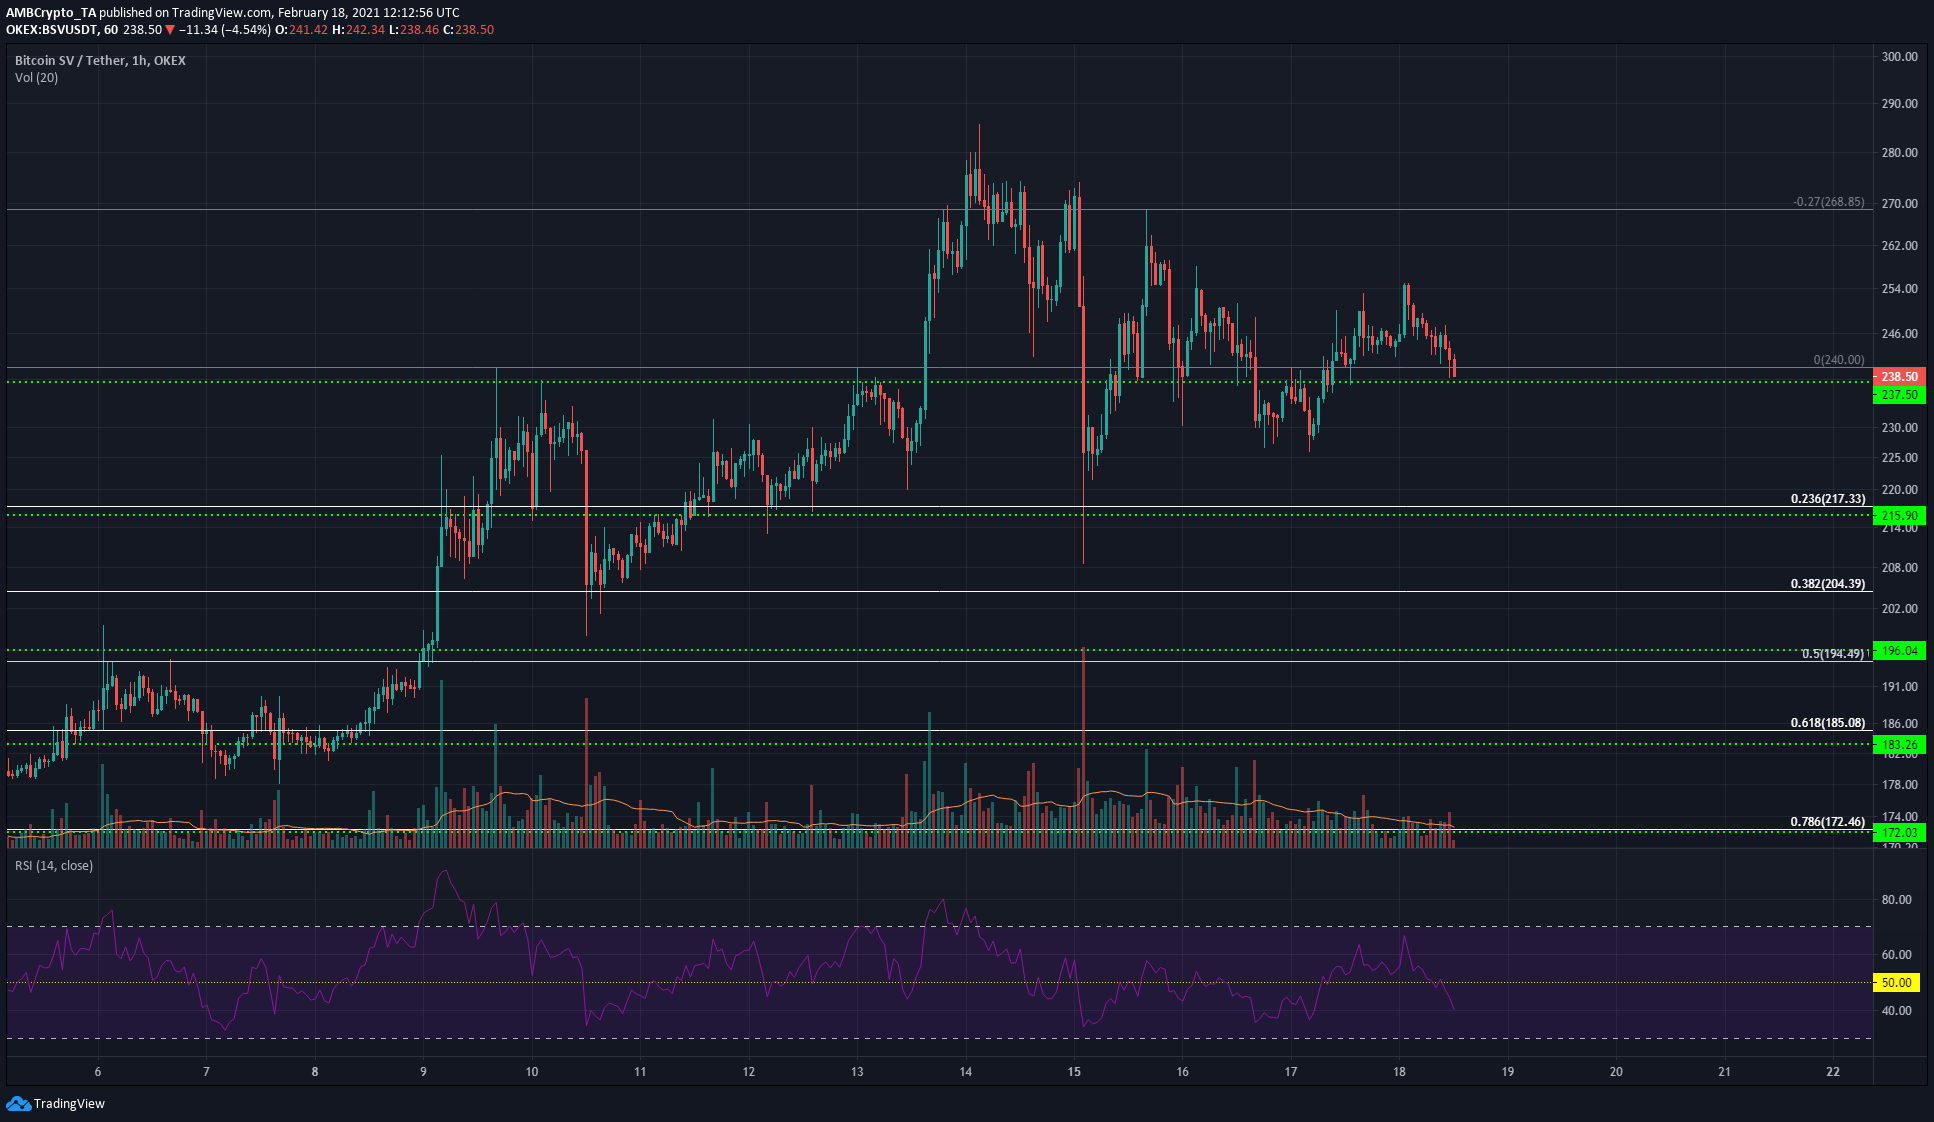
Source: BSV/USDT on TradingView
On the hourly chart, the RSI was dipping. It fell into the bearish zone after the previous day’s trading, with BSV noting losses after a brief hike past $250.
The Fibonacci retracement level at $237 is expected to hold as support, provided Bitcoin doesn’t see a strong move to the downside. Further, Long-term momentum for BSV was still in favor of the bears, and a deeper correction under $230 could not be projected, as of press time.
Closing under $237 could still see buyers step in at the $230-mark, making the $230-$240 range a region of demand that BSV bulls can’t afford to cede to the bears.
Neo [NEO]
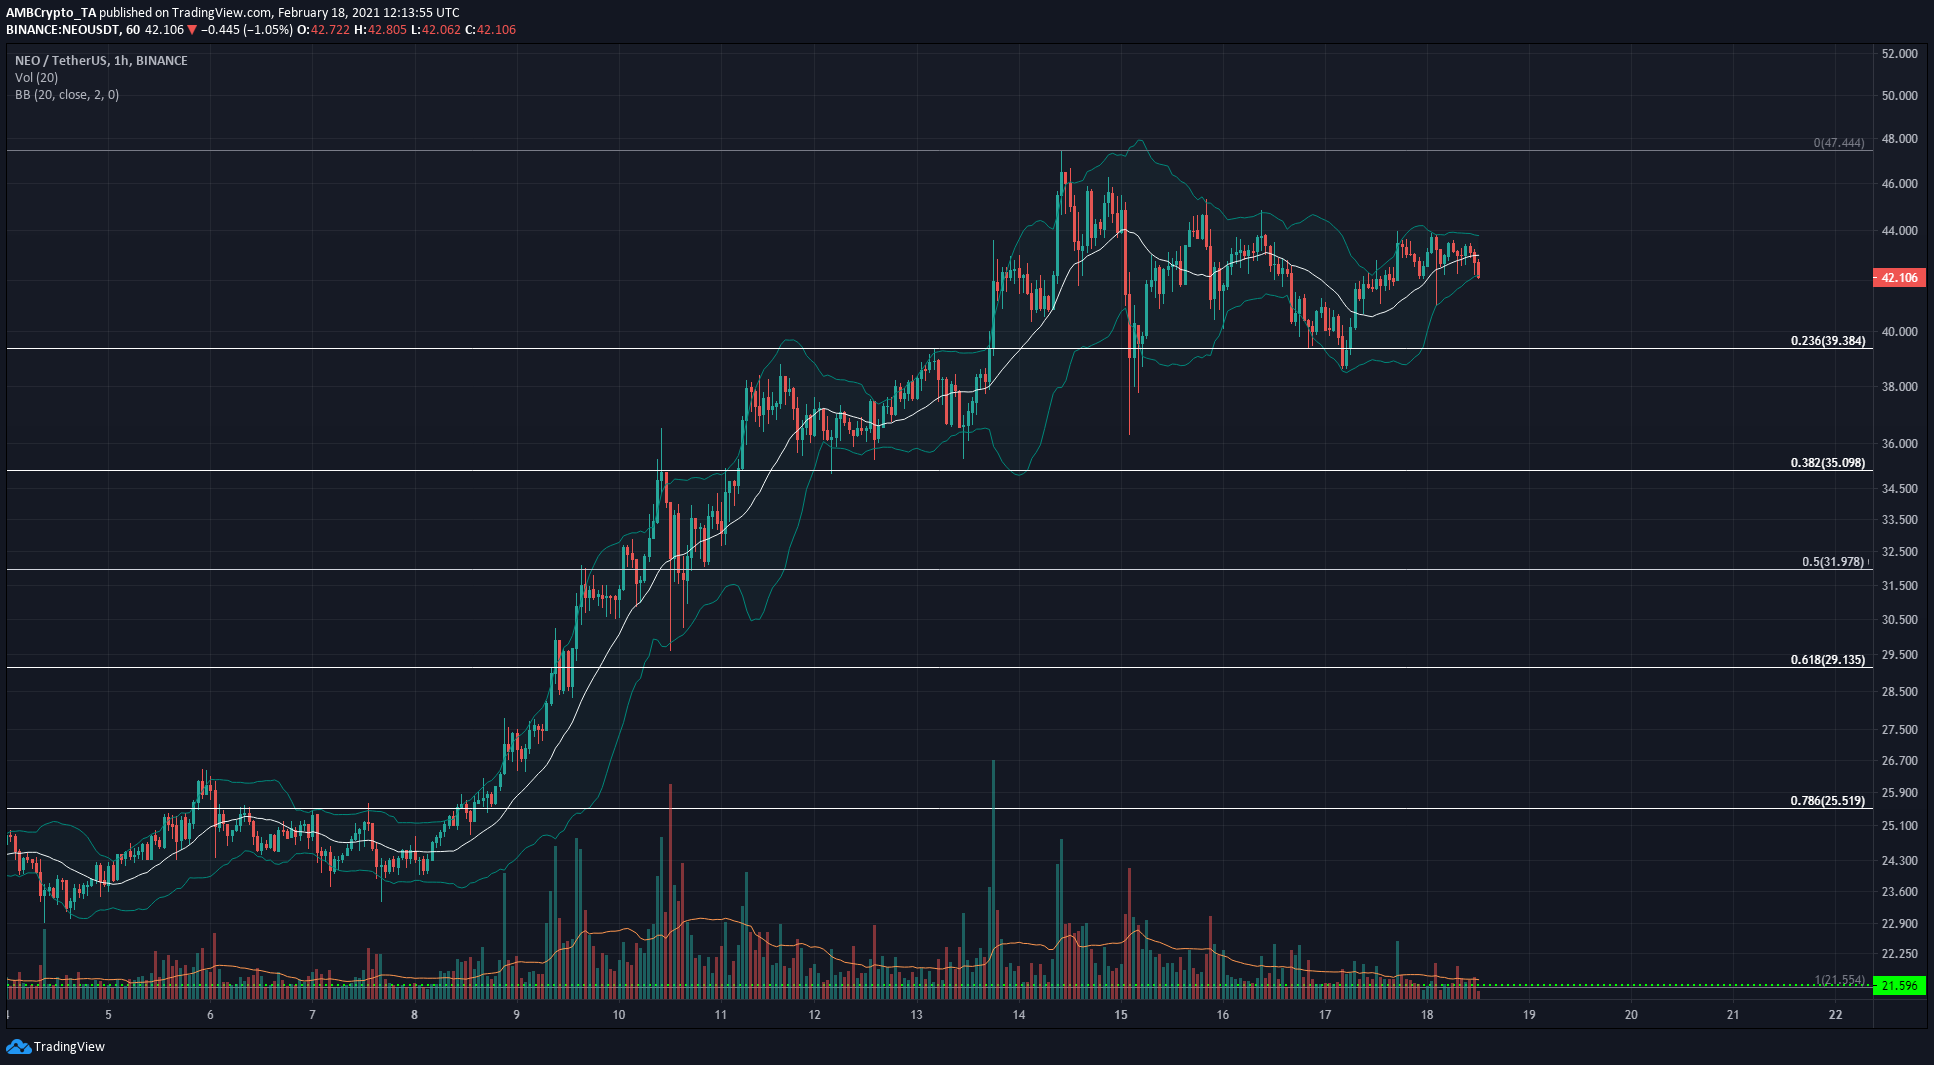
Source: NEO/USDT on TradingView
Neo has exhibited bullish strength over the past month, and at the time of writing, was in a brief phase of consolidation. On the hourly chart, trading volume had dropped significantly while the Bollinger Bands also tightened around the price to indicate falling volatility.
The $39-region has held on as support in the face of a lot of bearish pressure. Closing under this level and staying under it for more than a few hours will reinforce the bearish strength in the market and could see NEO tumble towards $35.
VeChain [VET]

Source: VET/USDT on TradingView
VET formed a range over the past week, with the range boundaries at $0.046 below and $0.057 overhead.
The OBV was also more or less in equilibrium over the same period. If anything, the past few days gave some slight advantage to the buyers on the OBV as it slowly ticked upwards.
The MACD also noted bullish momentum. When combined with VET’s hike past the mid-point of the range at $0.051, it was projected that VET was likely to retest the range highs once more.


![Why Chainlink [LINK] and Polygon [MATIC] are more similar than you realise](https://ambcrypto.com/wp-content/uploads/2024/04/Chainlink_and_Polygon-1-400x240.webp)