Bitcoin SV approached a level of resistance with bullish momentum and looked to break out to the upside, at press time. NEM also showed promise as it gathered strength just under its own level of resistance. Finally, Verge had strong bullish momentum but lacked trading volume at the time of writing.
Bitcoin SV [BSV]
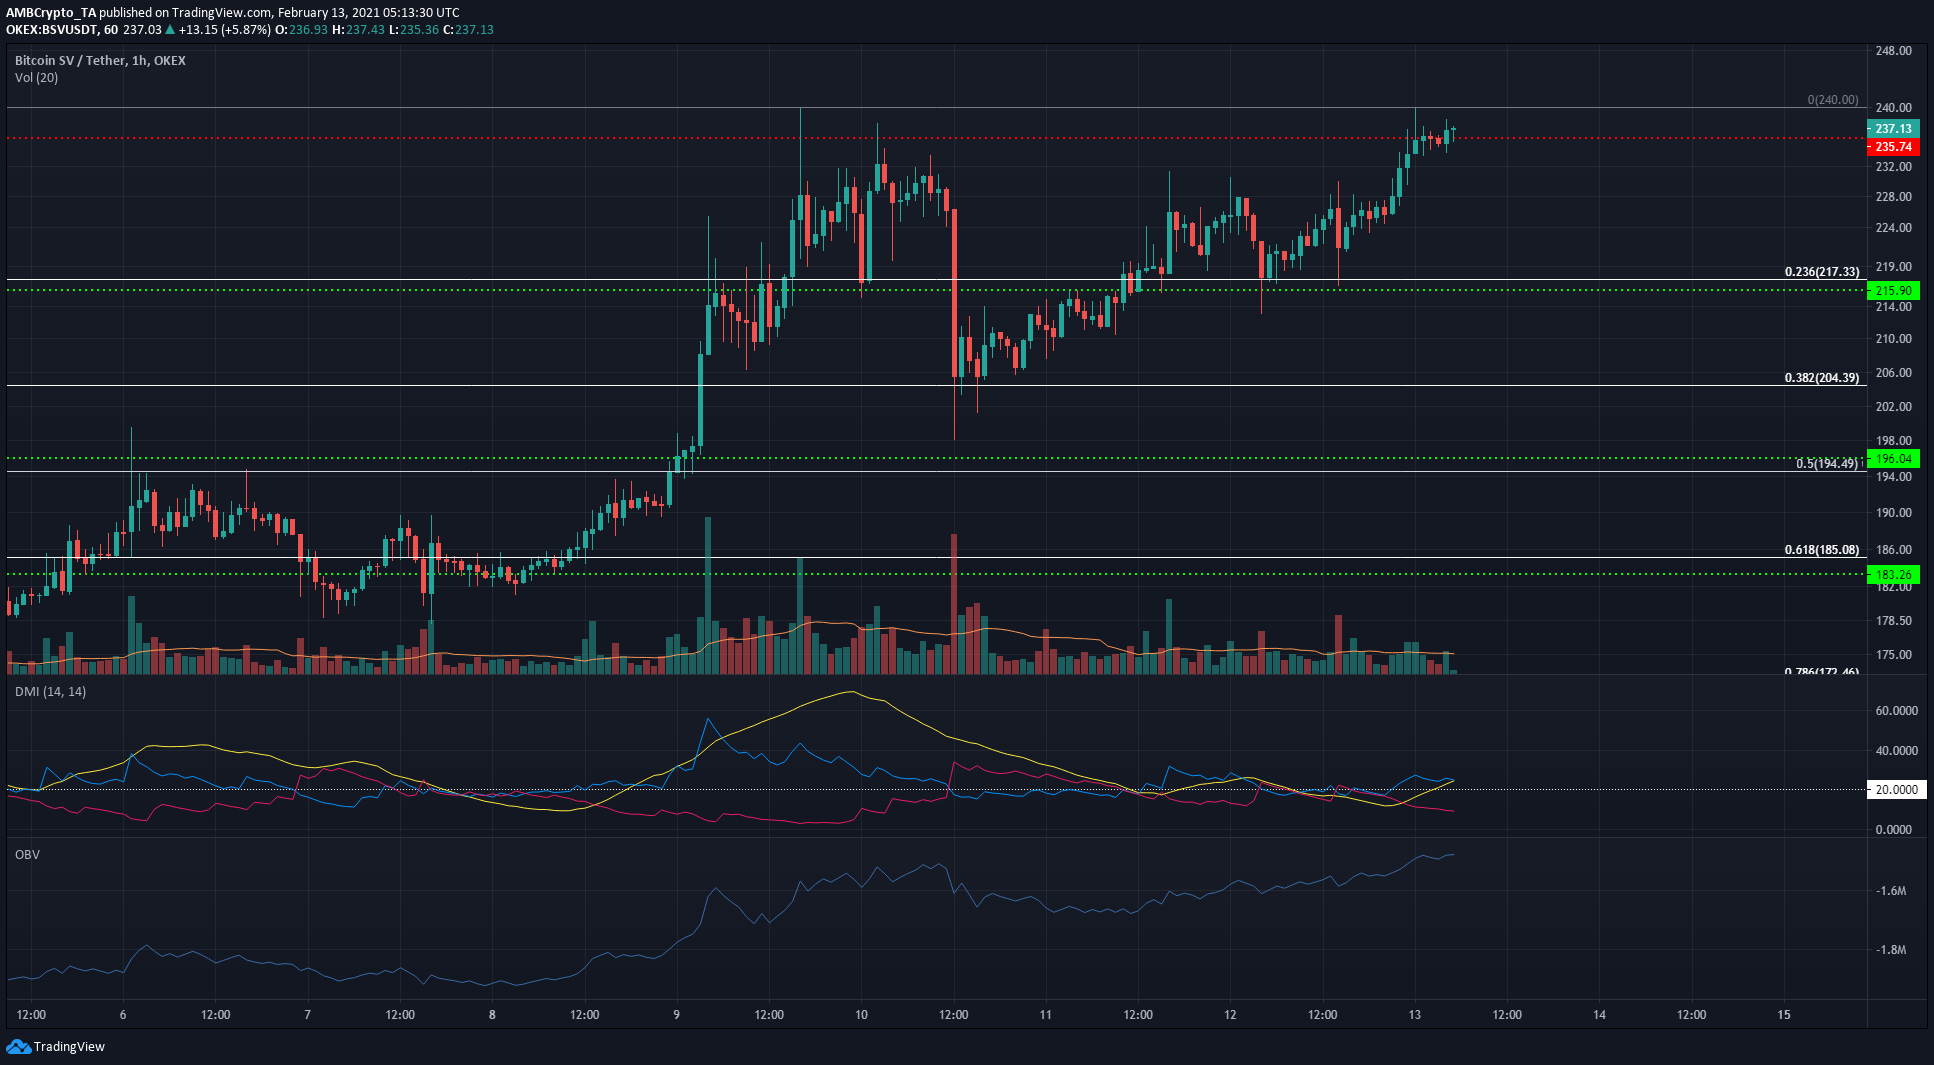
Source: BSV/USDT on TradingView
A few days ago, BSV formed a local high at $240 but selling pressure forced the coin lower on the charts. It tested the 38.2% retracement level at $204 and support, but over the past few days, BSV has recovered well.
It established a steady uptrend and had strong momentum as it approached the region of resistance from $230-$236. The Directional Movement Index showed both the ADX (yellow) and +DI (blue) rising, underlining a strong uptrend. The OBV also rose steadily to show that buying volume outweighed selling volume.
At the time of writing, BSV was trading at $237 and looked likely to break out to the upside on this second attempt. Trading volume has been consistent, but not heavy and would need to pick up to validate BSV’s breakout to the upside.
NEM [XEM]
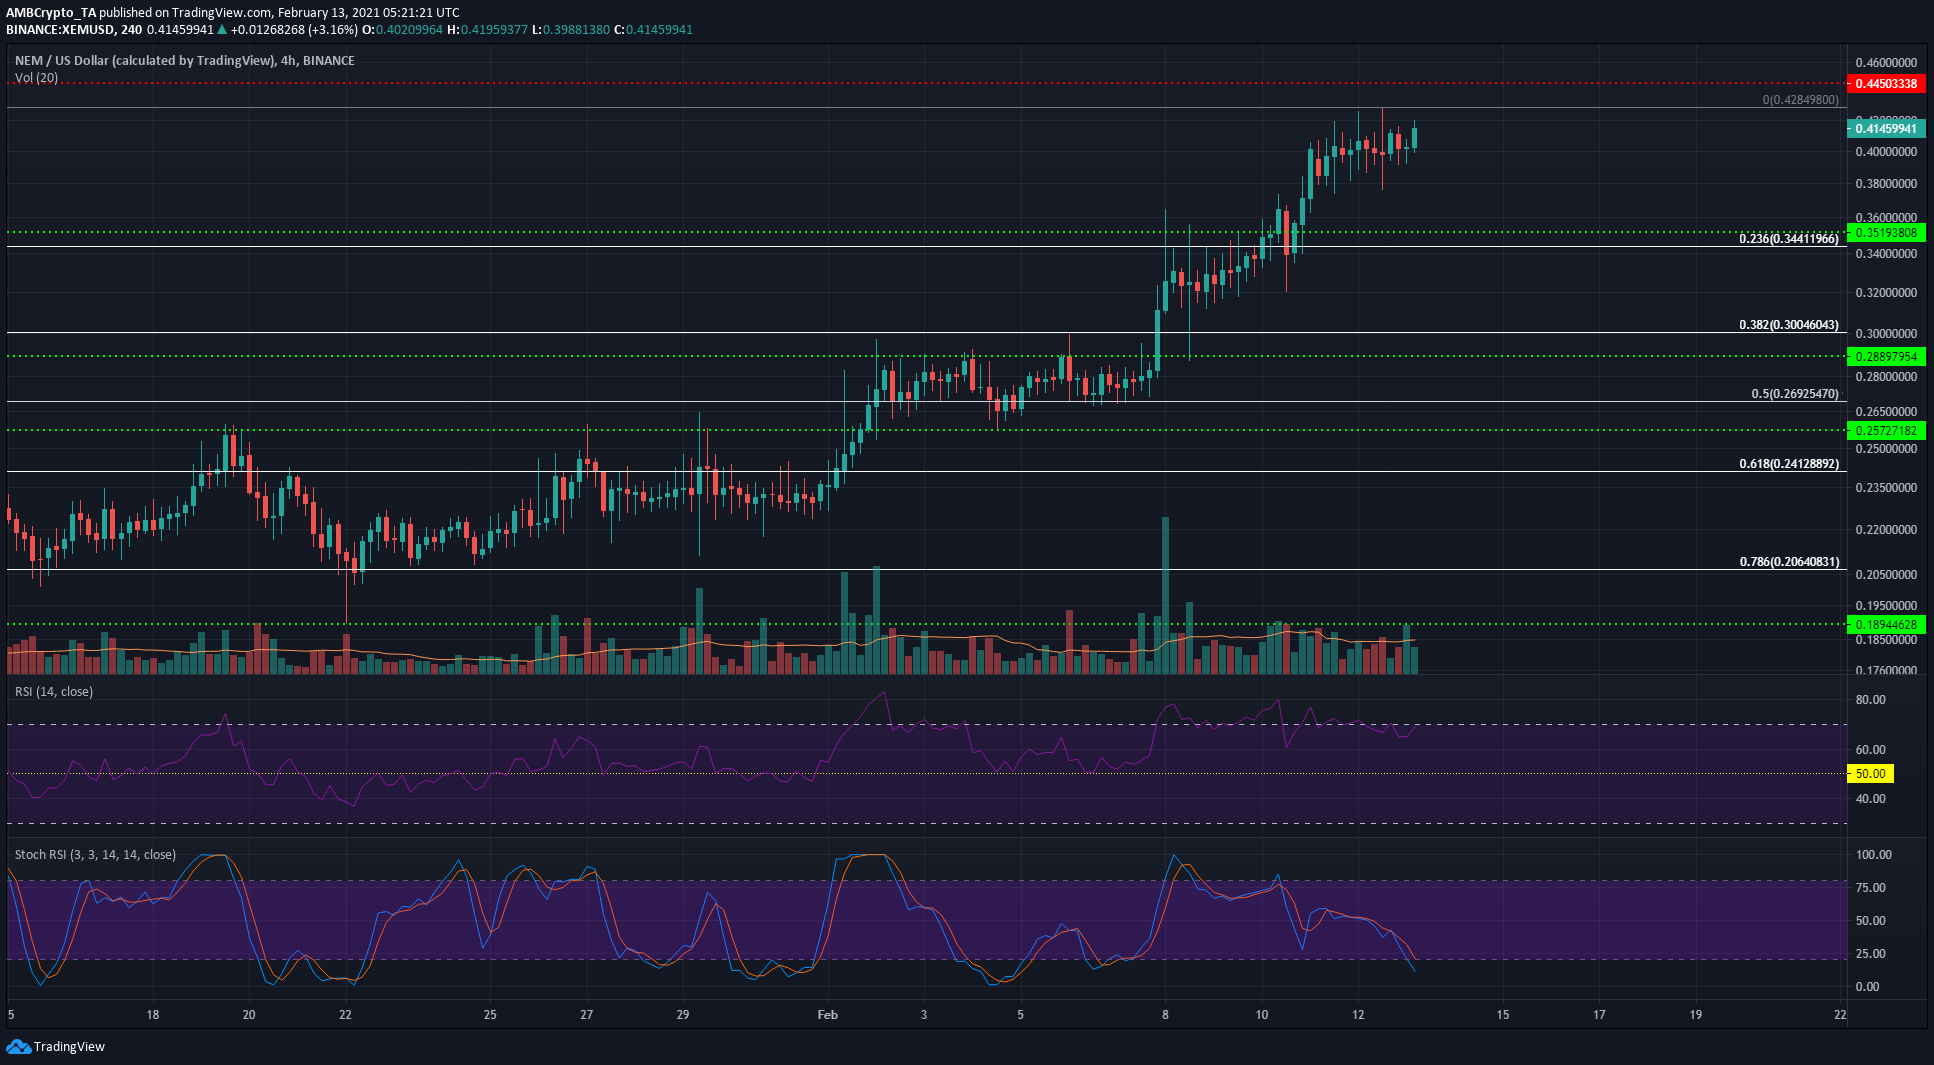
Source: XEM/USD on TradingView
The RSI highlighted strong bullish momentum as XEM traded around the $0.41-mark. Over the past two weeks, XEM saw quick gains of 20-25% followed by a few days of sideways trading, and this pattern is likely to repeat to effect a move beyond the $0.43-$0.445 region.
The Stochastic RSI was heading lower on the charts – the gains XEM made in steps were followed closely by the rapid rise of the Stochastic RSI too, making this indicator one to keep an eye on to enter the next move.
Verge [XVG]
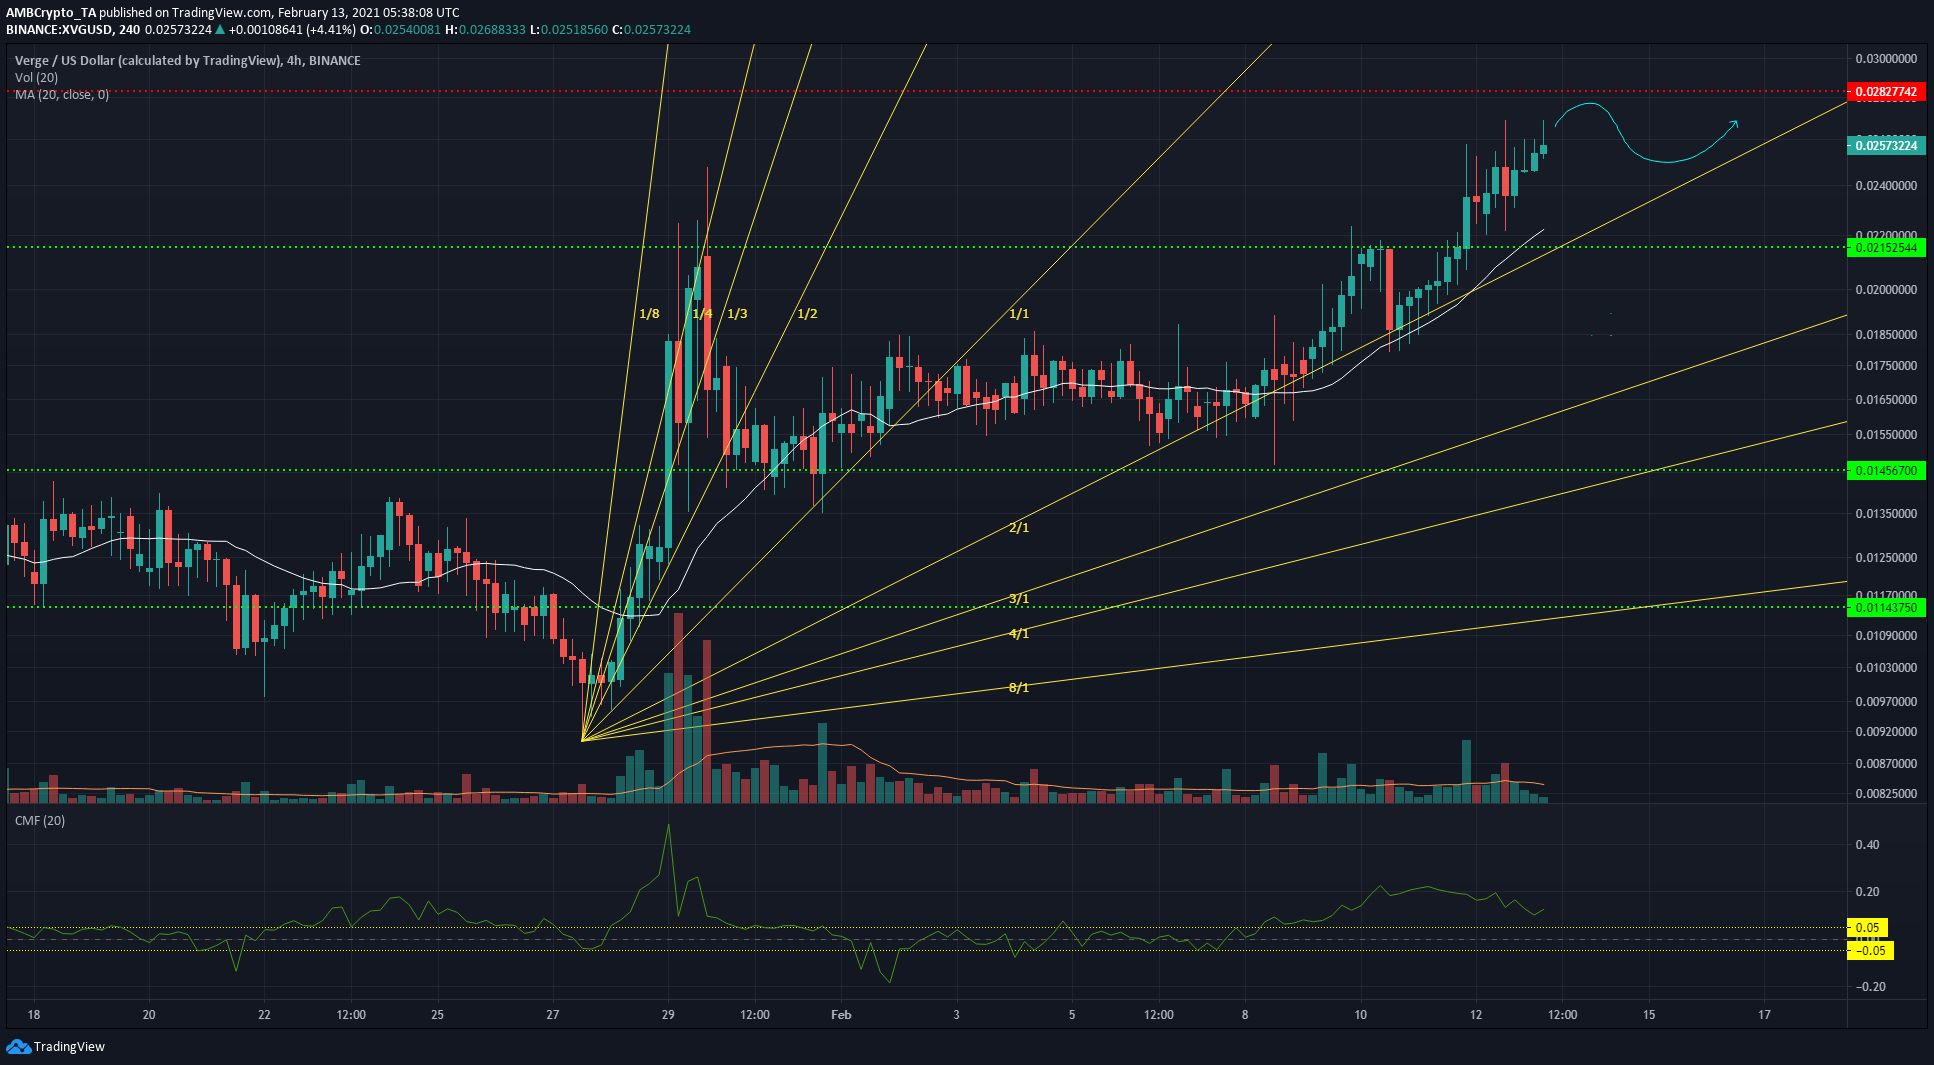
Source: XVG/USD on TradingView
The 20-period moving average (white) on the 4-hour chart was moving under the price and highlighted strong bullish momentum. The Chaikin Money Flow was also above +0.05, underlining the net capital flows into the market and highlighting buyer dominance.
The Gann fan (yellow) pointed to a potential area of support, should the $0.028-level of resistance reject XVG.
The path highlighted by the cyan could be a scenario for XVG in the event of rejection, while a breakout past $0.028 would mean that the next level of significant resistance for bulls would be at $0.033.