Bitcoin Cash, Waves, Dogecoin Price Analysis: 29 March

Bitcoin Cash dropped sharply beneath $514 but recovered to climb back above the $500 mark, while Dogecoin bounced off $0.0495 and tried weakly to climb past $0.0541. Waves bulls were attempting to breach the $12.4 resistance level.
Bitcoin Cash [BCH]
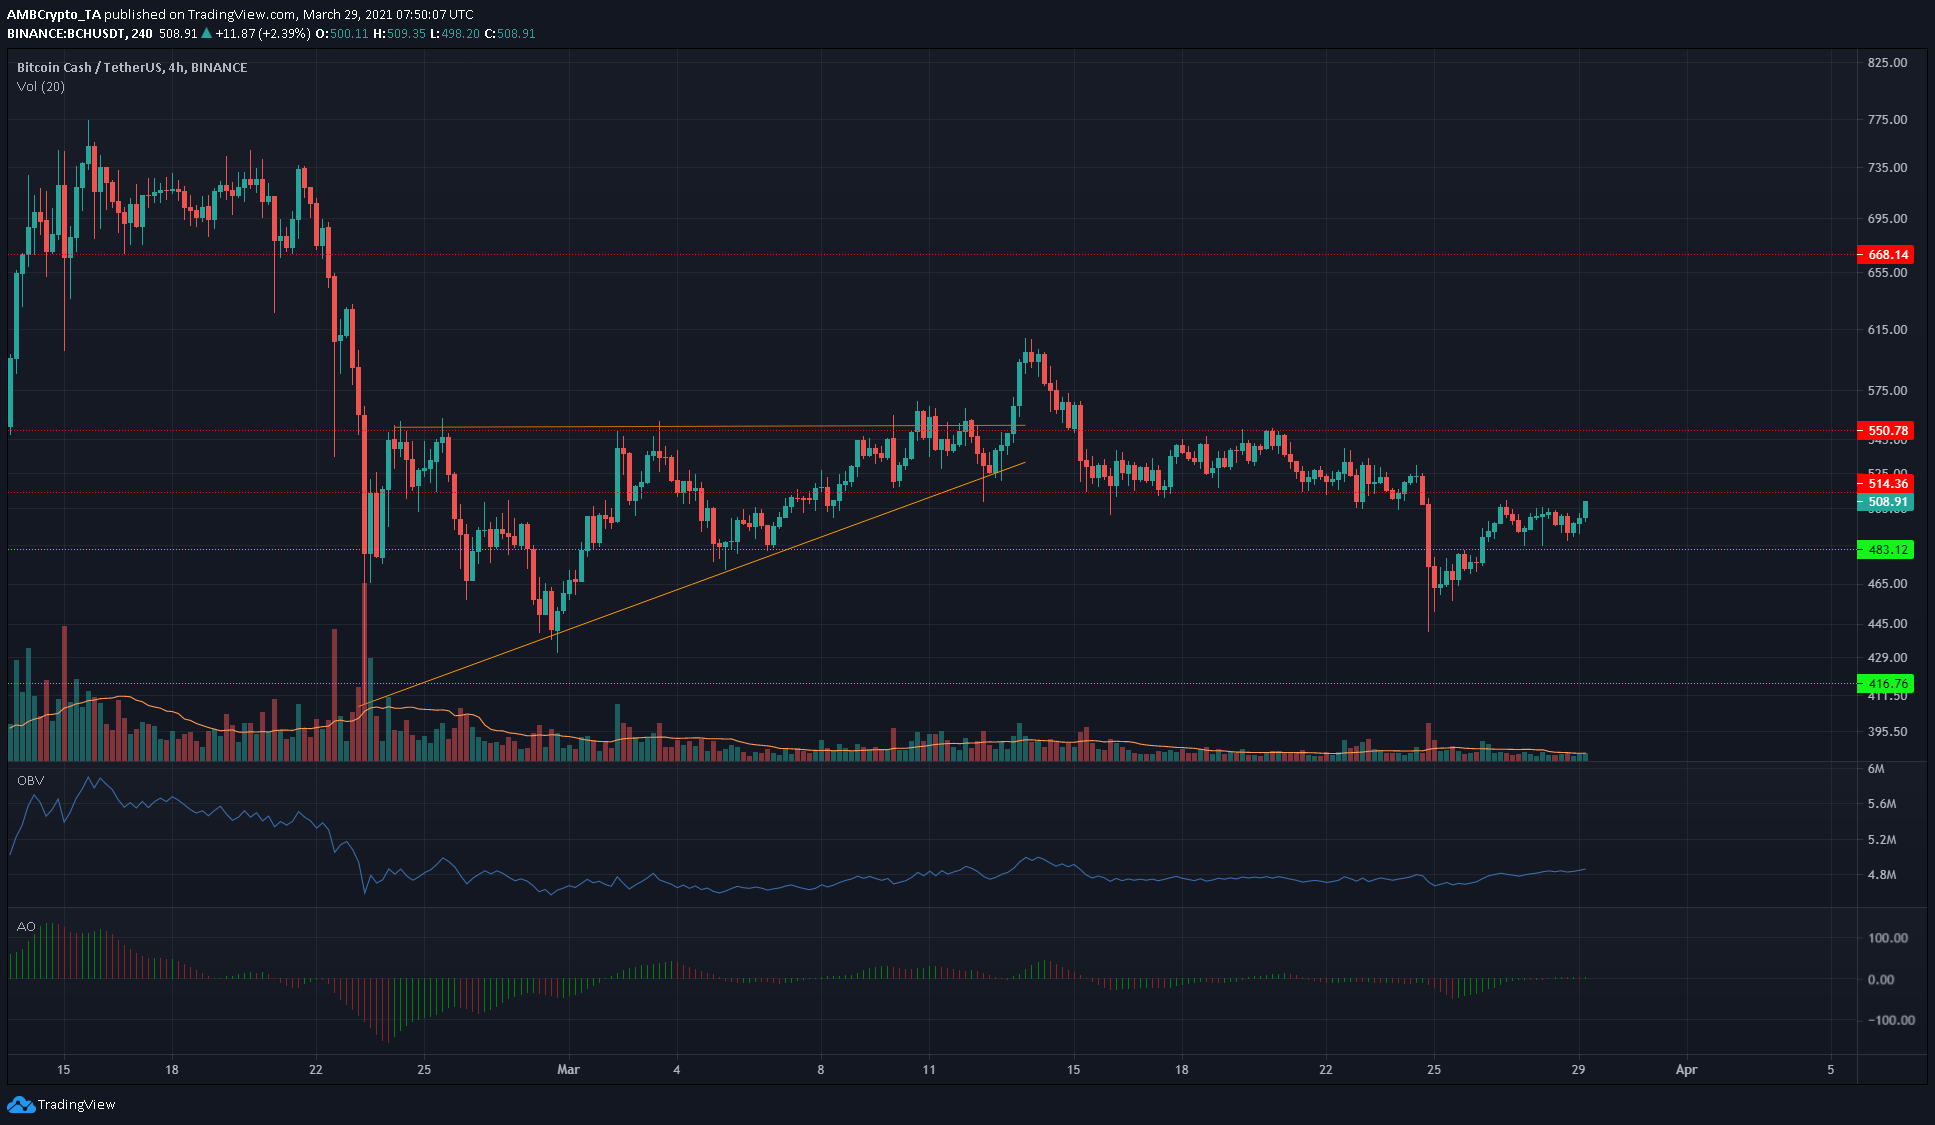
The ascending triangle’s failed breakout saw BCH stagnate above the $514 mark, and the past week saw a sharp descent as low as $445 for BCH before bouncing to trade at $508 at the time of writing.
However, the OBV did not see a significant spike in either direction. The late-February levels on the OBV are yet to be breached as buyers and sellers have been in equilibrium in terms of trading volume since then, although buyers appeared to have a slight advantage in recent days.
The Awesome Oscillator reflected the price action by showing a lack of momentum as it faintly crossed above the zero line.
Waves [WAVES]
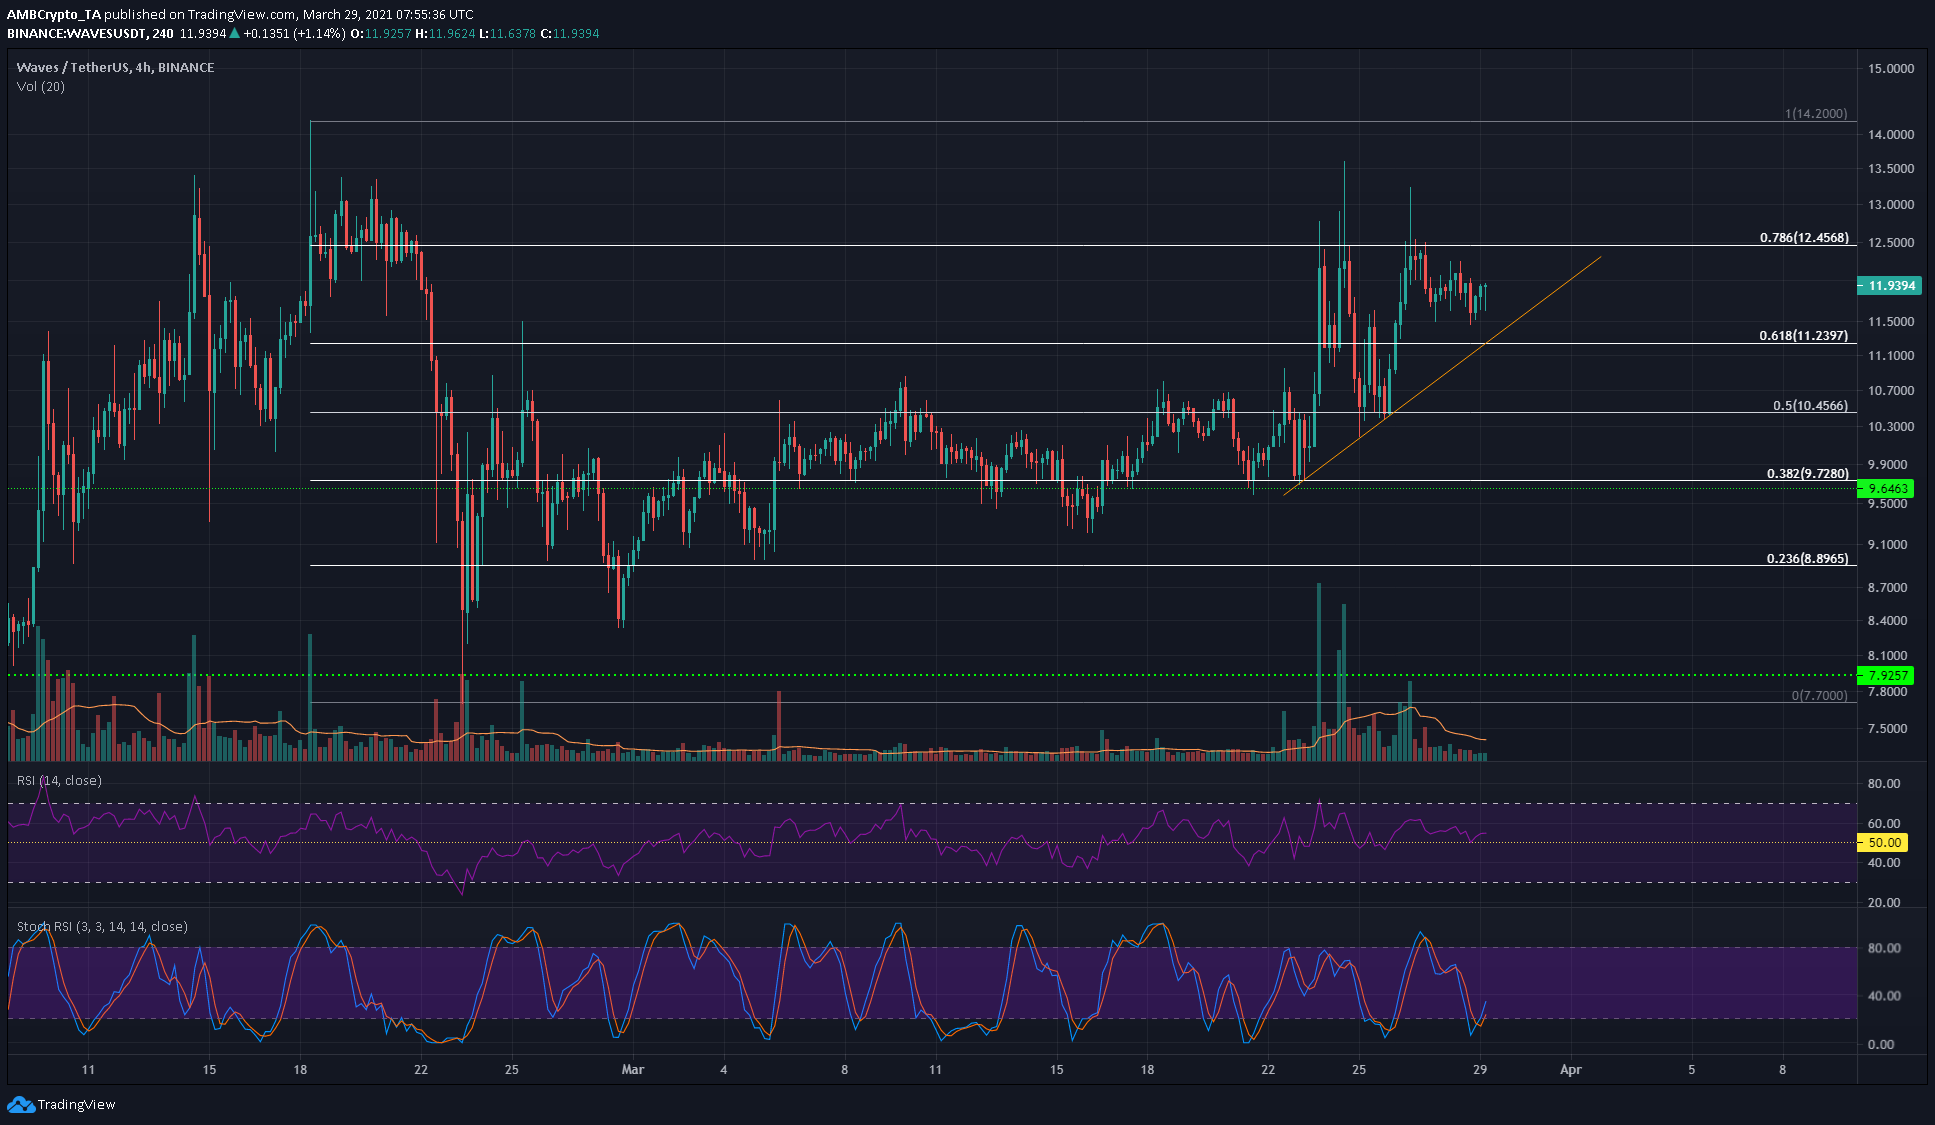
The ascending trendline of the past week represents dynamic support for WAVES- the price found steady resistance at the $12.45 level and the ascending trendline, if retested, would form an ascending triangle pattern and could see a breakout to the upside.
The RSI showed a value of 54, and the Stochastic RSI was recovering from oversold territory.
Flipping the $12.3 would be an opportunity to open a long position targeting $14.2, while the 61.8% and 50% retracement levels are horizontal supports.
Dogecoin [DOGE]
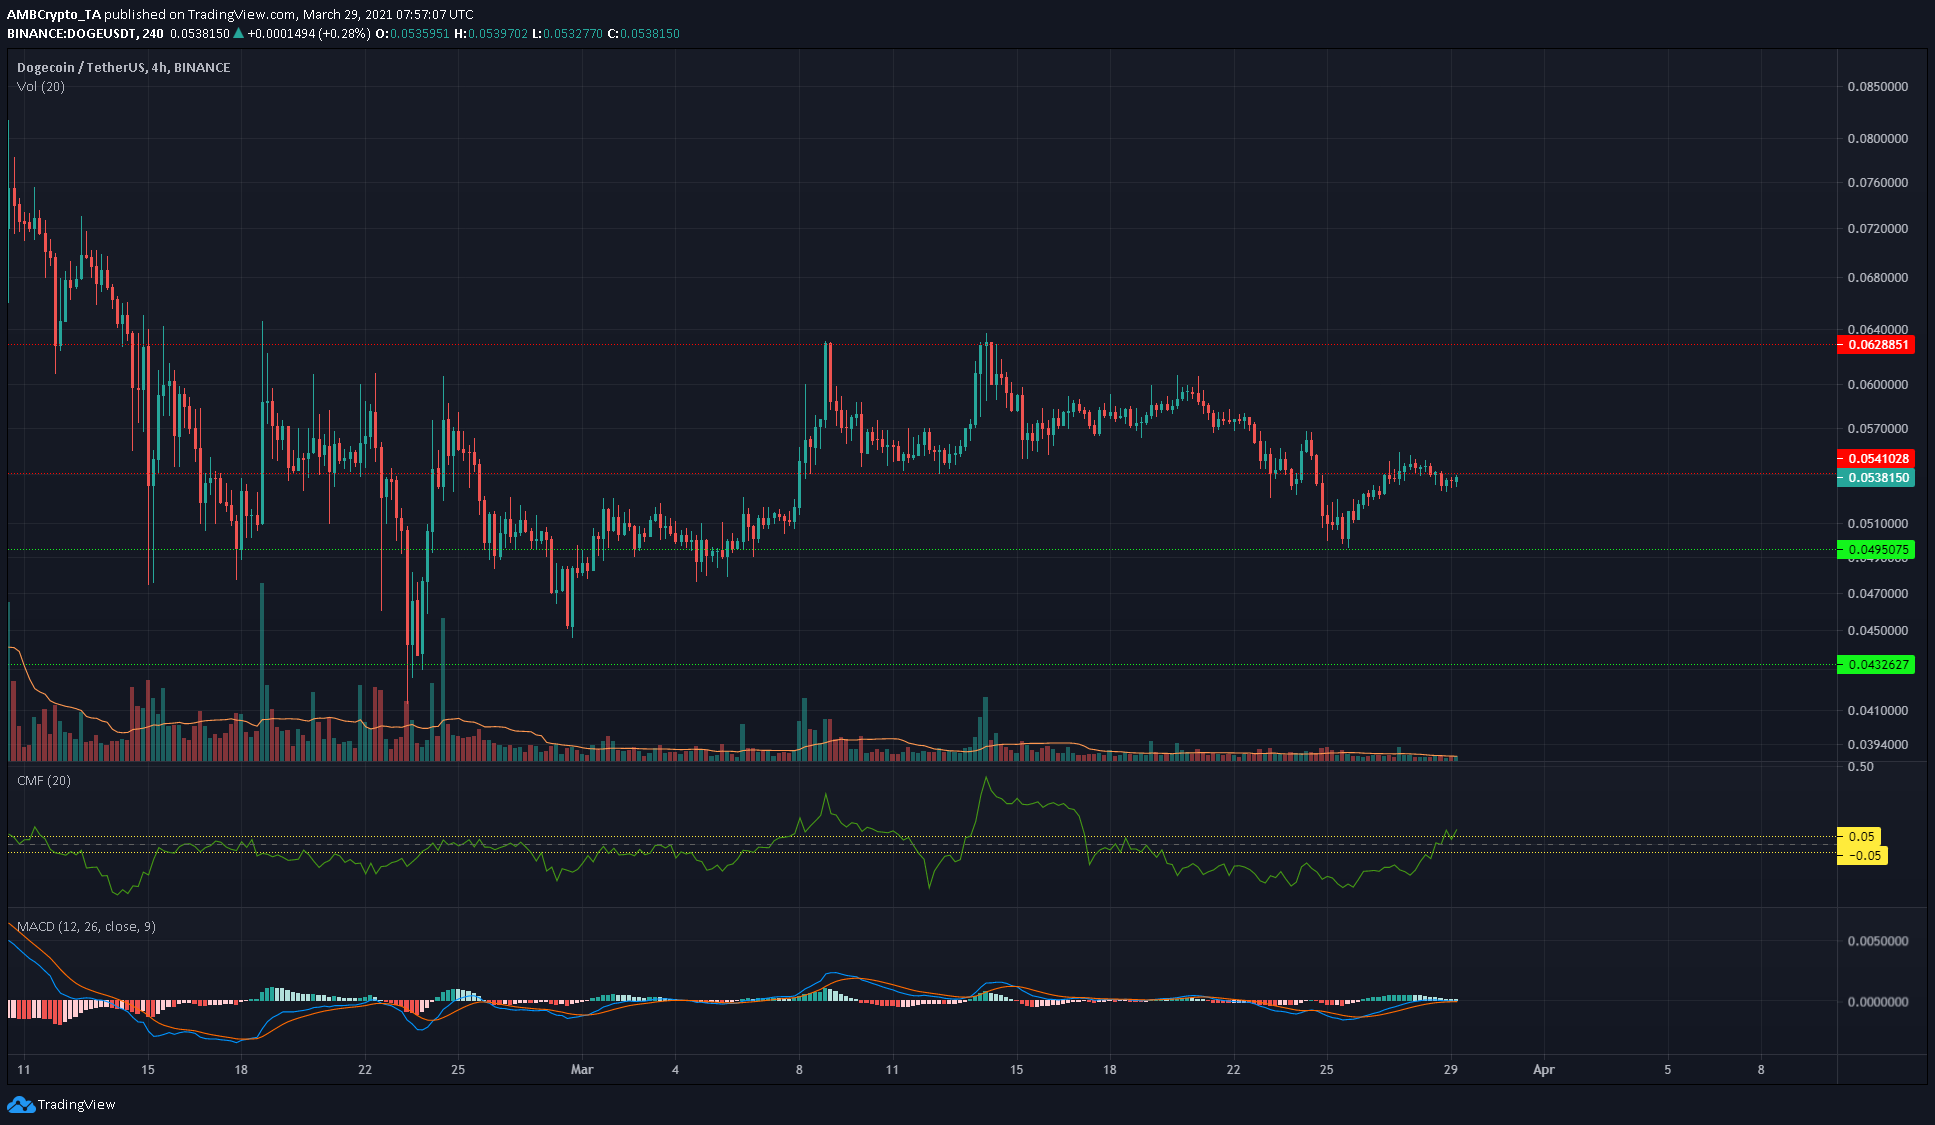
Dogecoin briefly climbed above the $0.054 level but gradually receded back beneath it. On the MACD indicator, the MACD and signal lines were one atop each other on the zero line, showing an absence of momentum. Trading volume was also below average in recent sessions.
The Chaikin Money Flow climbed above +0.05, showing net capital flow into the market to denote buyers were stronger. Trading sessions with above-average volume alongside rising bullish momentum can be used to buy, following the $0.0541 flip to support.