
Bitcoin Cash moved back below its 200-SMA after the price fell by 11% from the $600-level. IOTA was projected to break lower from its horizontal channel, while COMP could also move south from its descending triangle on the back of bearish indicators.
Bitcoin Cash [BCH]
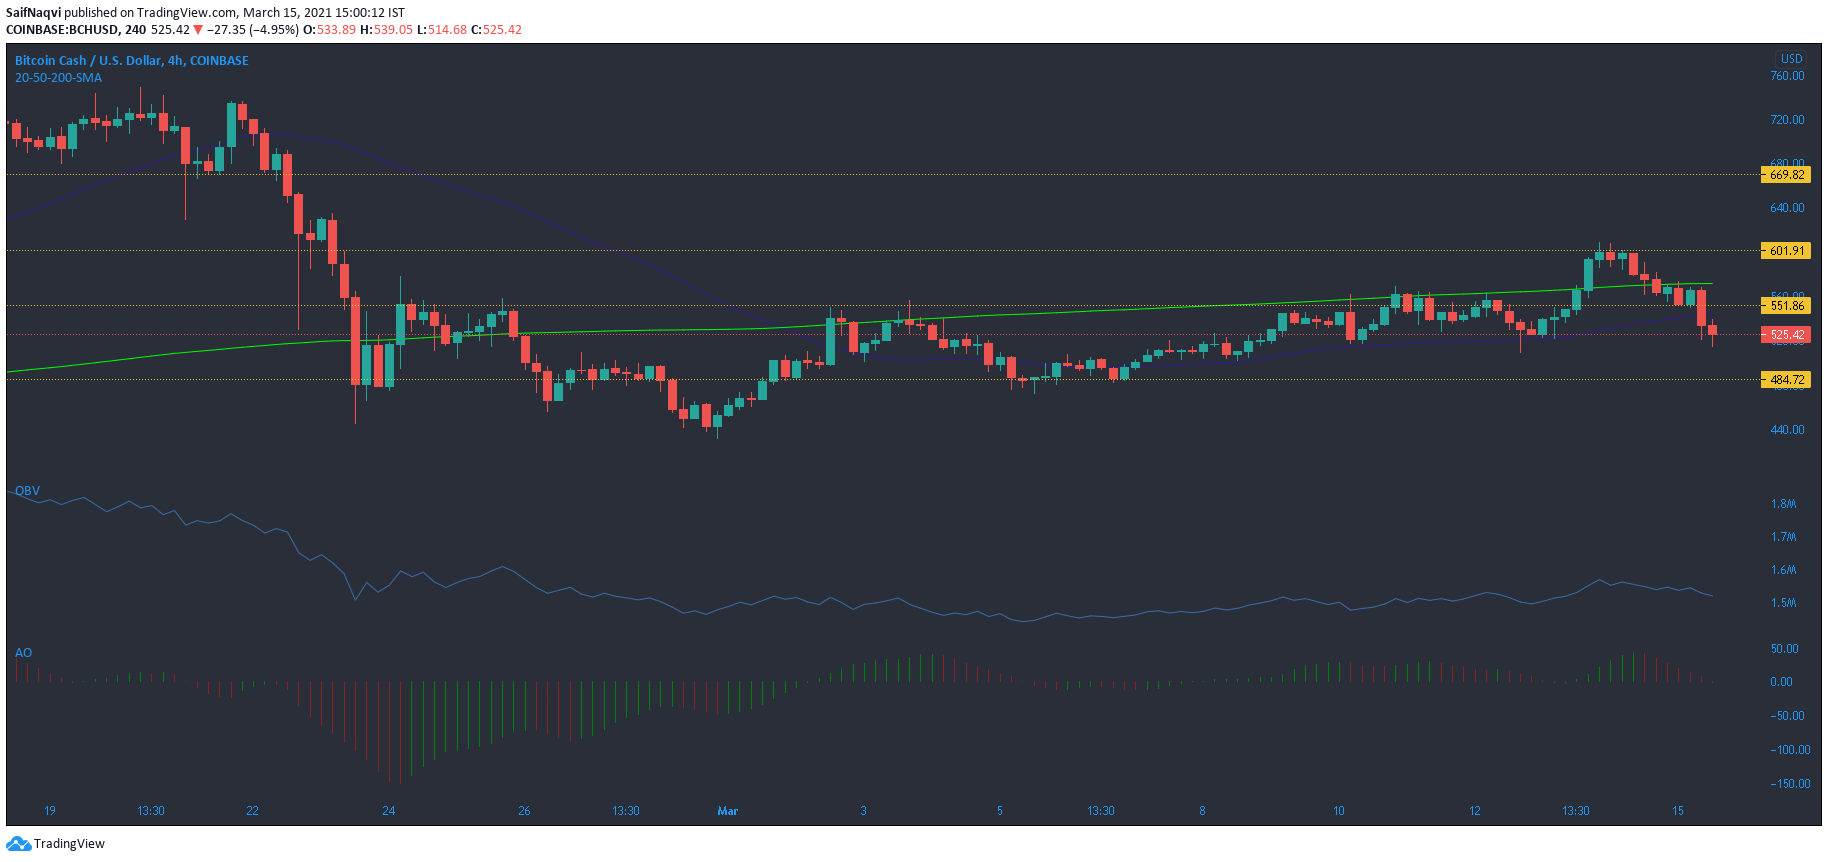
Source: BCH/USD, TradingView
The 200-SMA (green) formed a stern resistance and highlighted bearish conditions in the Bitcoin Cash market as the candlesticks moved beneath their long-term moving average line. Even though yesterday saw some positive movement on BCH, the price dropped by over 11% after touching its upper ceiling at $601.9.
The On Balance Volume highlighted the selling activity as the index formed lower lows. The Awesome Oscillator showed strong momentum on the selling side. Support at $484.7 would likely cut additional losses if the sell-off extends for a few more sessions. A bullish bounce back would first depend on the BCH’s ability to sustain itself above the 200-SMA.
IOTA
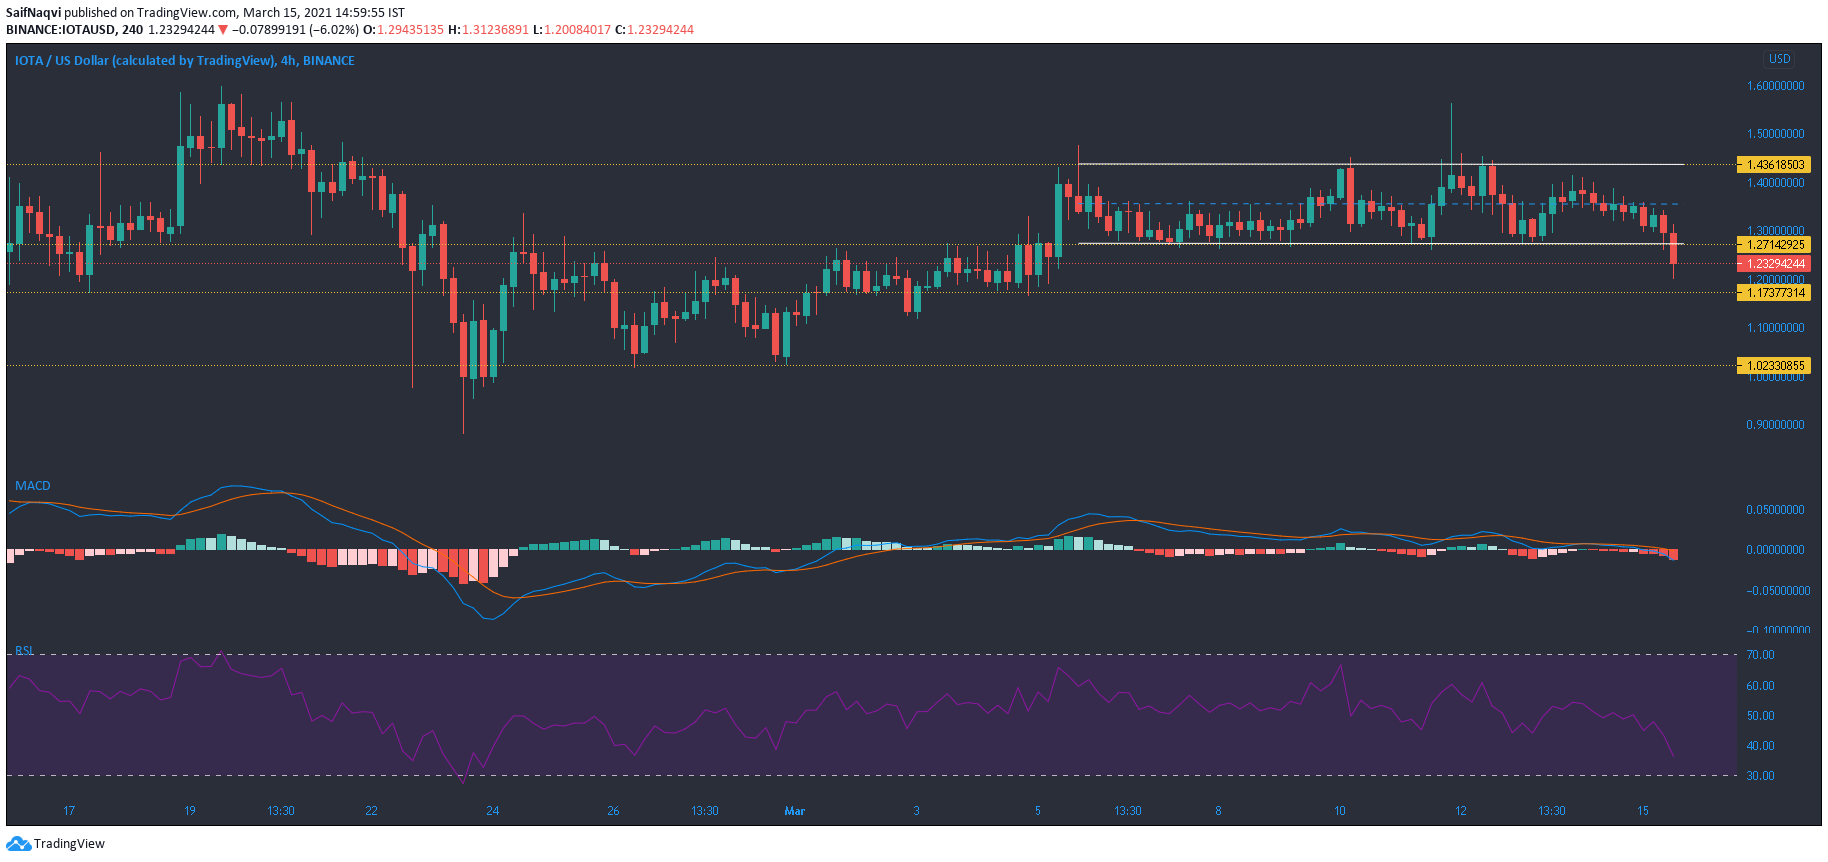
Source: IOTA/USD, TradingView
The area between $1.43 and $1.27 represented a horizontal channel for IOTA and saw strong price oscillation for the last 10 days. However, the cryptocurrency looked to breakdown from this channel after the price dropped by over 6% in the last 24 hours. Traders looking to capitalize on the fall can open short positions at the current price level but must wait for a confirmation or a retest of the lower trendline.
The MACD line moved beneath the Signal line as the market remained in control with the sellers. The RSI pointed south from the 40-mark. Support levels reside at $1.17 and $1.02 on the 4-hour timeframe.
Compound [COMP]
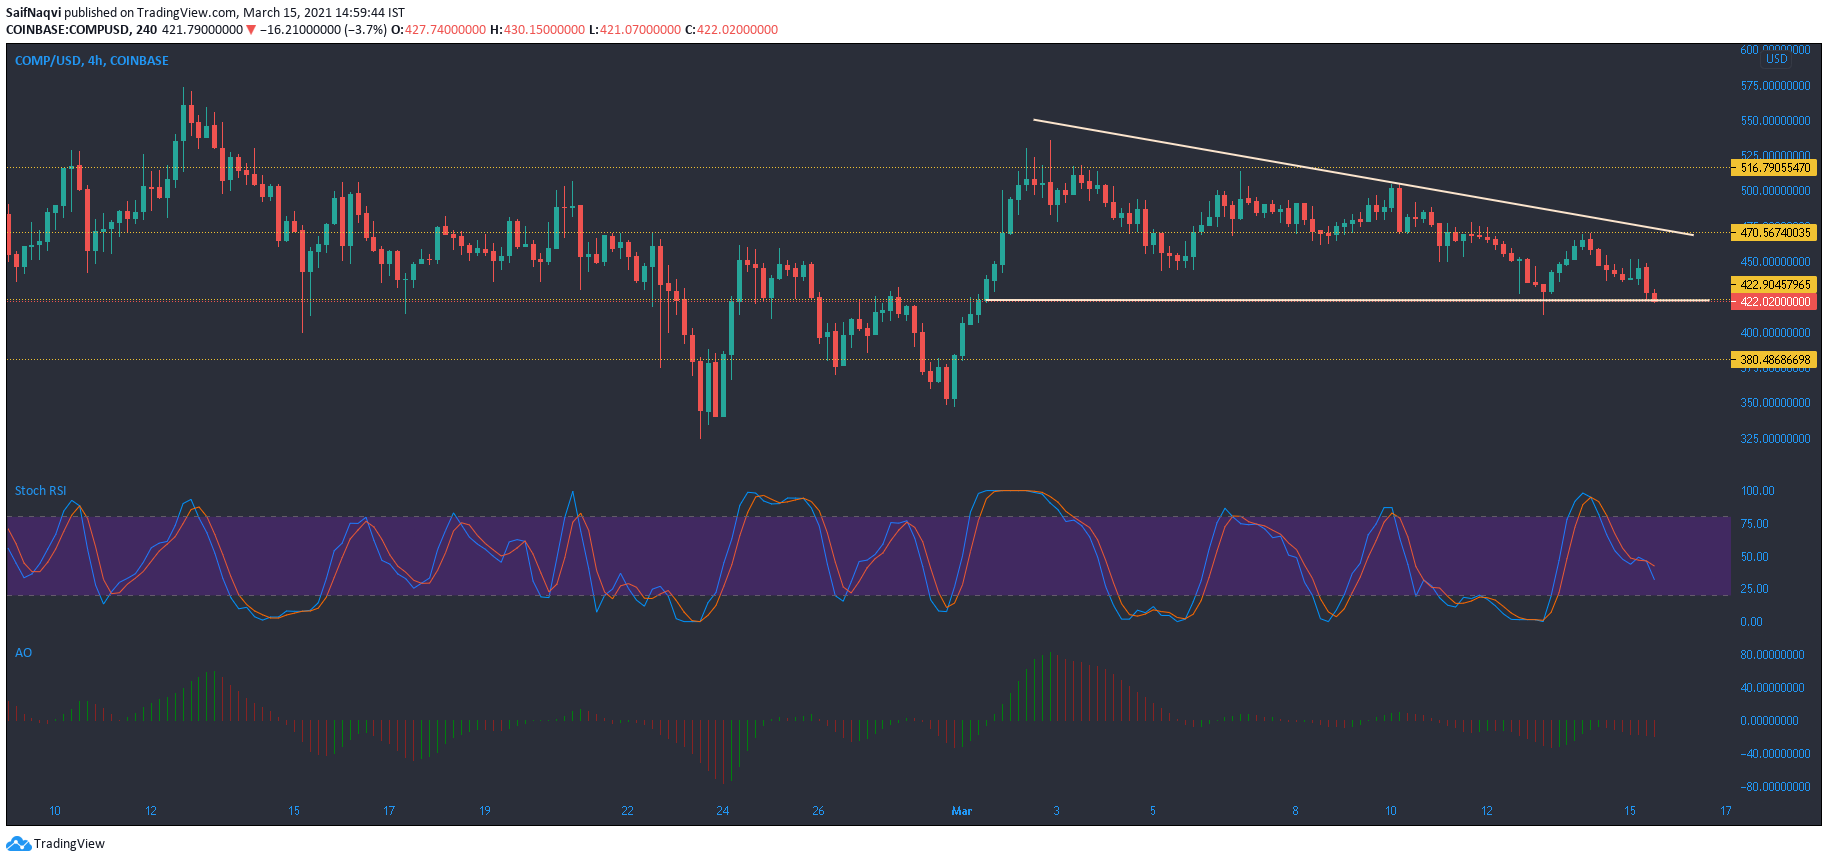
Source: COMP/USD, TradingView
Losses over the last seven days now amounted to over 9% as Compound dropped steadily from $516.9 resistance. A descending triangle formed in the process after COMP made lower lows on its descent to $422.9 support. Trading volumes were consistent with a breakdown prediction and were minimal at the time of writing. Support at $380.48 could be in focus if the price moved southbound from the bottom trendline.
Momentum was on the bearish side according to the Awesome Oscillator, while the Stochastic RSI tilted slightly in favor of the sellers as well. A breakout in the opposite direction could see the price rise north of the $470 level, but that would largely depend on bullish cues from the broader market.