Bitcoin Cash could regain the region above $740 if the bulls deny a breakdown over the coming sessions. FTX Token was tipped to hold on to $48.4-support, while Algorand was not yet ready to climb above its horizontal channel.
Bitcoin Cash [BCH]

Source: BCH/USD, TradingView
Judging by Bitcoin Cash’s trend since March 25, the cryptocurrency has combated brief periods of correction and maintained its uptrend on the 4-hour timeframe. If the same logic is used, BCH could maintain its upwards cycle after negotiating the current bearishness in price. If $668.5 support is maintained by the bulls, then BCH could surge past $740 over the short-mid term.
However, a bearish divergence on the RSI sent some warning signs across the market. If the RSI dips below 40, then BCH would be under the threat of a reversal. Even the OBV noted some selling pressure over the last few sessions.
FTX Token [FTT]

Source: FTT/USD, TradingView
At the time of writing, FTX Token moved south from an ascending channel after an impressive run from $39.7-support. For now, there was some support available at $48.4 and weak trading volumes suggested that the bulls would hold on to this support line.
Historically, the flow of institutional money has had a strong correlation with FTT’s price and this was evident on the CMF. If the CMF does slip below the half-line, FTT could be up for more losses over the coming sessions. Meanwhile, the Awesome Oscillator noted rising momentum on the bearish side. A strong level of support resides at $41.8 and a move towards this could offer some buy signals for long-term traders.
Algorand [ALGO]
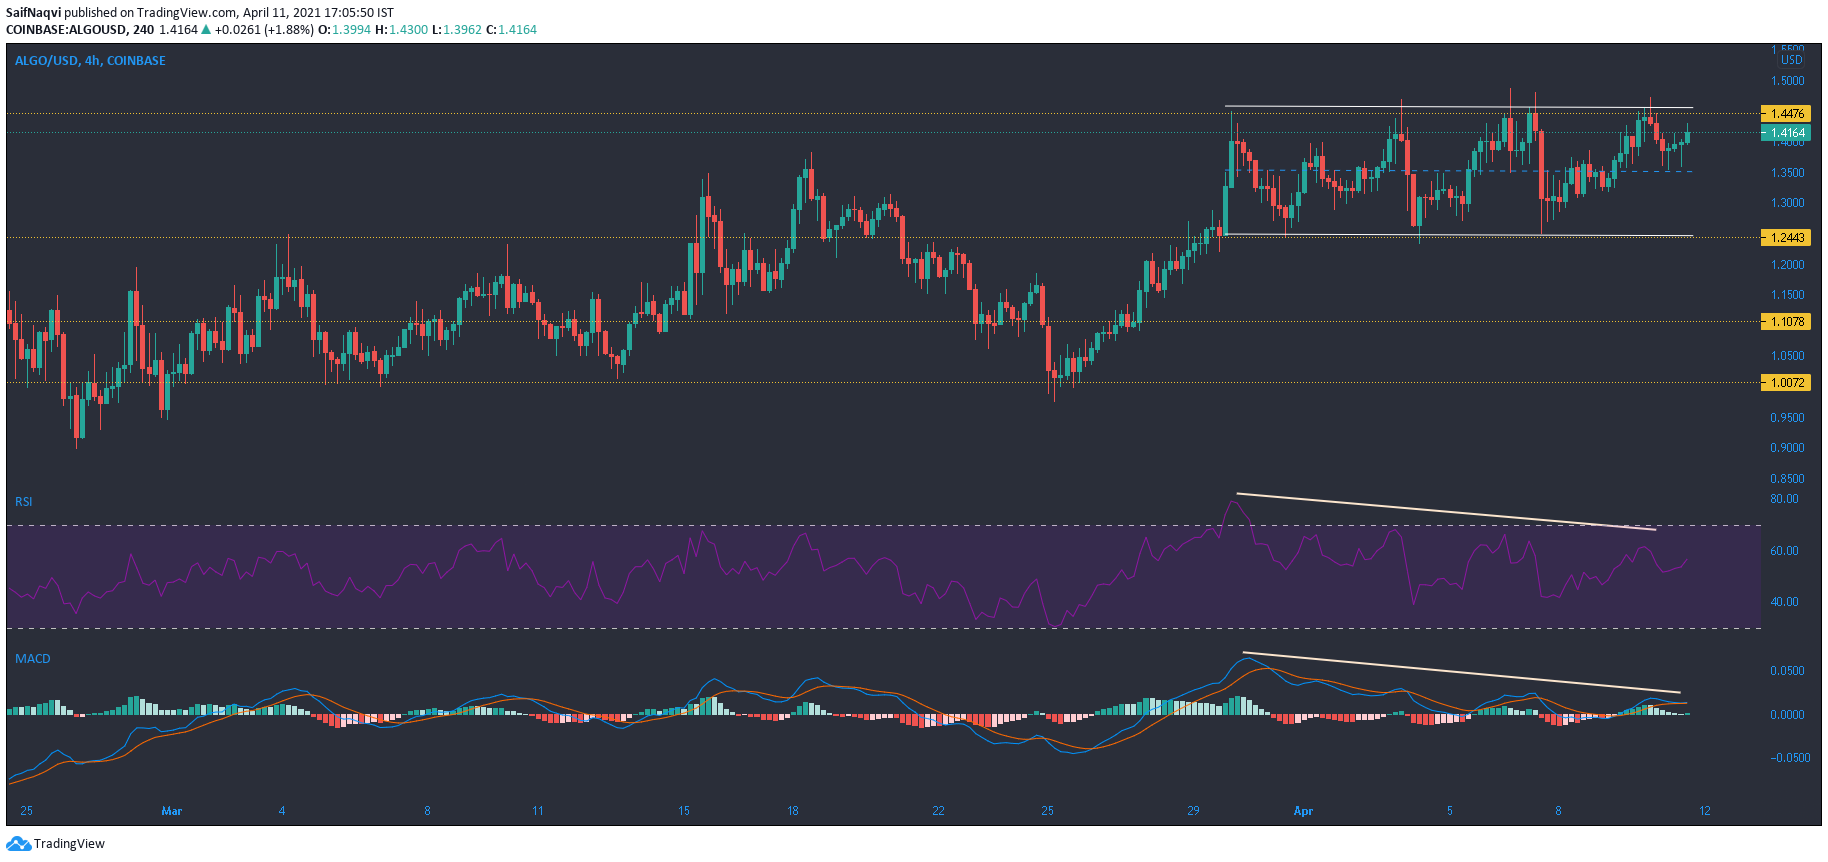
Source: ALGO/USD, TradingView
There were few developments in Algorand’s market over the last 24-hours. Even though the price was in the red at press time, the movement was well within a horizontal channel and above the equilibrium line.
However, bearish divergences on both the RSI and MACD suggested weakness in the current price. While the RSI pointed north from 50 and reflected a degree of neutrality, the MACD closed in on a bearish crossover. This does not necessarily point towards a breakdown, but it certainly worked against an upwards breakout especially since the volumes have been trending lower as well.