
Bitcoin Cash stayed below the elusive 38.2% Fibonacci retracement level but bullish cues from the broader market could soon change its fortunes. Dash attempted to retake the $231 level, while ENJ projected deeper losses on the back of bearish indicators.
Bitcoin Cash [BCH]
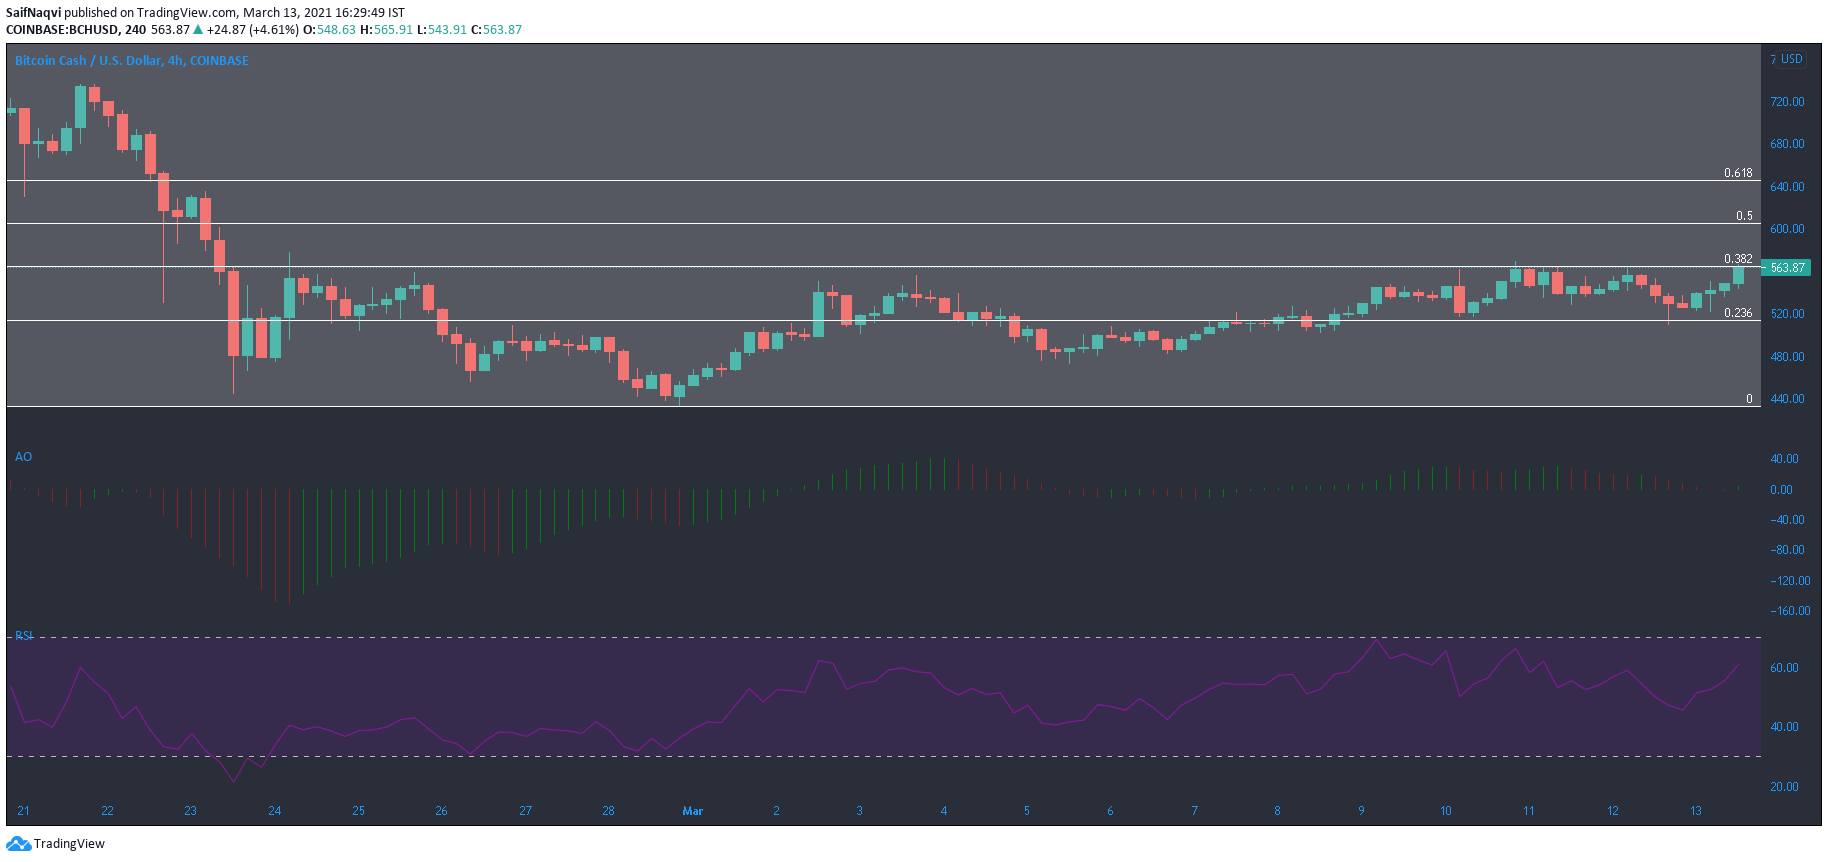
Source: BCH/USD, TradingView
Bitcoin Cash took cues from the broader market and posted slight gains after the king coin rose above its previous ATH and eyed the $60,000 level. BCH traded at $565 at press time, up by over 3% in the past 24 hours. Its market cap clocked in at $10.5 billion, which was $1.6 Billion short of the 10th spot in the crypto rankings.
On the 4-hour charts, the price maintained its stance below the 38.2% Fibonacci level, a level that has not been breached since the broader market pullback in late-February. However, that could soon change if the green bars rose in length on the Awesome Oscillator. The RSI pointed north from above the 60-mark and showed bullish presence in the market. Bitcoin breaching its previous ATH would certainly be a plus for BCH’s price as well.
Dash [DASH]
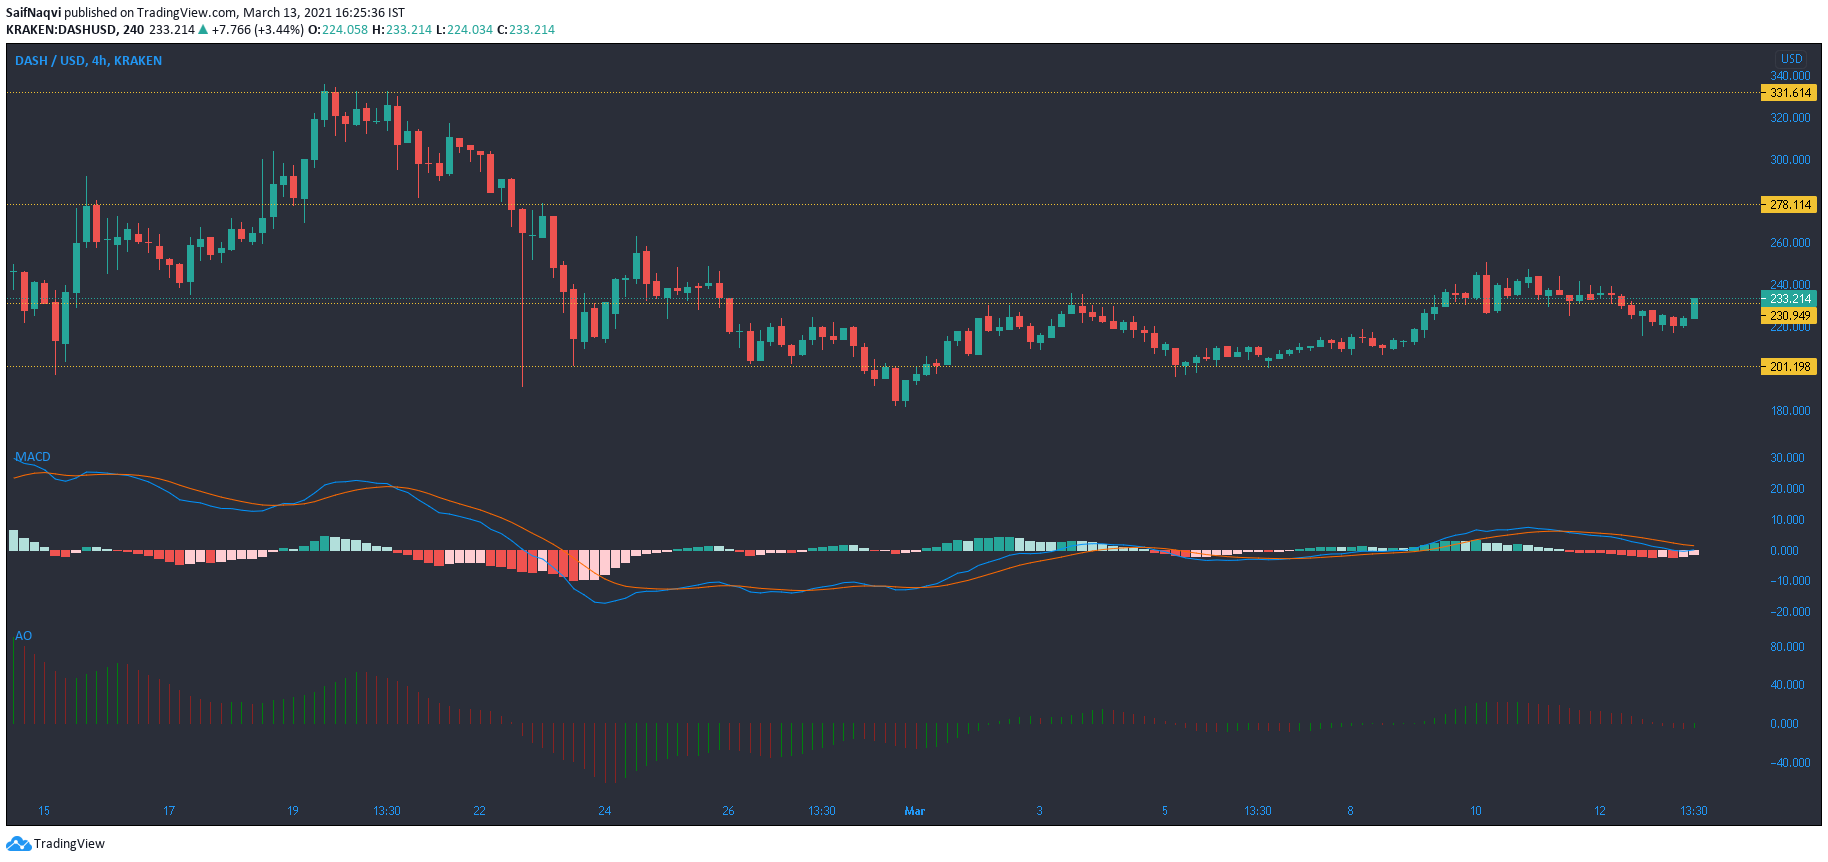
Source: DASH/USD, TradingView
The area above $230.9 resistance served as a sell-off region as Dash moved lower on two occasions post an upwards breakout on the 4-hour timeframe. At the time of writing, Dash tested the upper ceiling once again on the back of some bullishness in the market. The Awesome Oscillator tilted slightly towards the buying side, while the MACD reflected a similar sentiment.
If history were to repeat itself, Dash could move southbound soon after scaling above its upper barrier. The 24-hour trading volumes were not large enough to warrant a higher level, while buying activity remained muted.
Enjin Coin [ENJ]
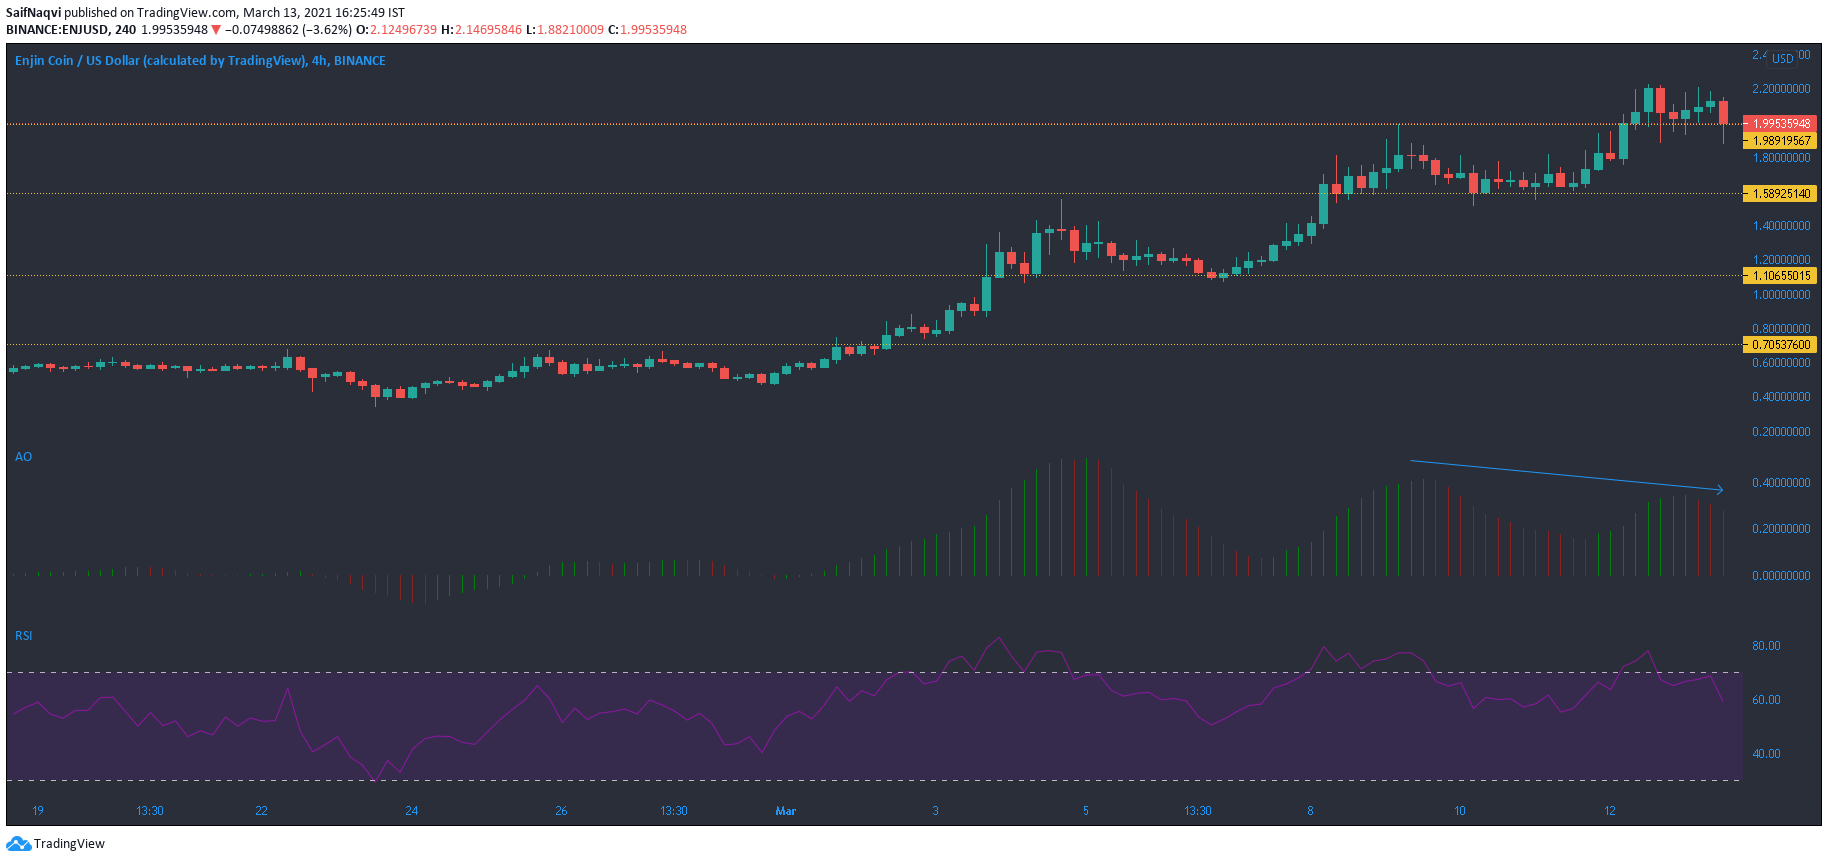
Source: ENJ/USD, TradingView
A bearish twin peak setup on the Awesome Oscillator showed that Enjin Coin was set up for a deeper correction over the coming sessions even though the current price was only 11% off from record levels. The RSI fell sharply from just below the overbought region, a sign that the bulls were losing control of the prices. Low volumes, however, suggested that the pullback was heightened mainly by the lack of buyers, as opposed to a strong sell-off.
In the event of a southbound move, support levels lie at $1.58 and $1.10.


![Why Chainlink [LINK] and Polygon [MATIC] are more similar than you realise](https://ambcrypto.com/wp-content/uploads/2024/04/Chainlink_and_Polygon-1-400x240.webp)

